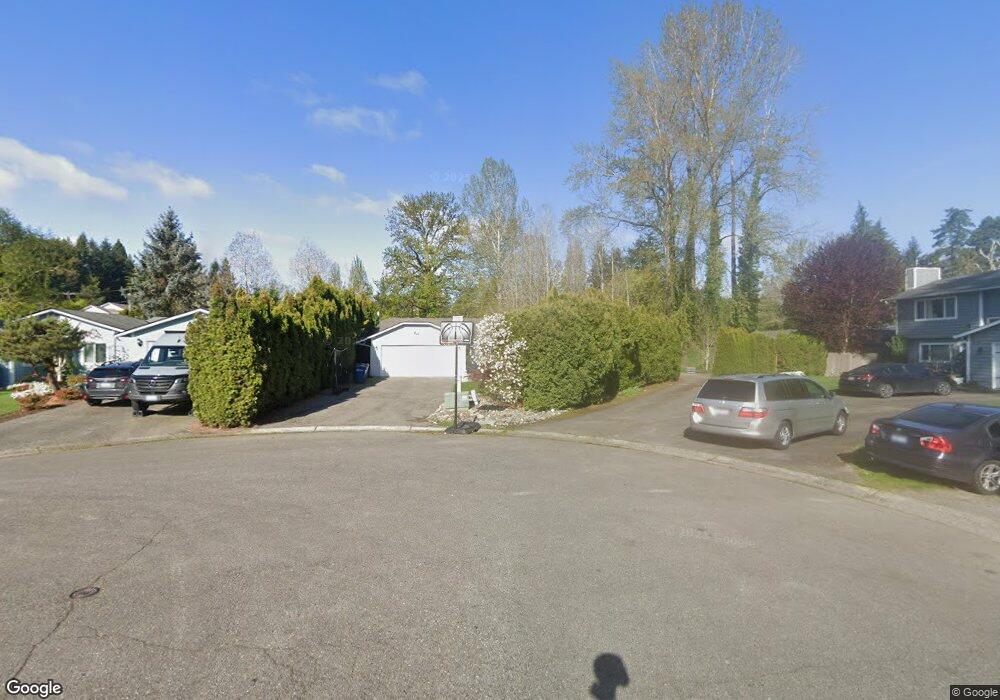
21628 7th Place W Bothell, WA 98021
Queensborough-Brentwood NeighborhoodEstimated Value: $742,000 - $832,000
3
Beds
2
Baths
1,360
Sq Ft
$573/Sq Ft
Est. Value
About This Home
This home is located at 21628 7th Place W, Bothell, WA 98021 and is currently estimated at $779,313, approximately $573 per square foot. 21628 7th Place W is a home located in Snohomish County with nearby schools including Frank Love Elementary School, Kenmore Middle School, and Bothell High School.
Ownership History
Date
Name
Owned For
Owner Type
Purchase Details
Closed on
Jul 25, 2017
Sold by
Davies Alex Matthew and Davies Khalisa
Bought by
Davies Khalisa
Current Estimated Value
Home Financials for this Owner
Home Financials are based on the most recent Mortgage that was taken out on this home.
Original Mortgage
$602,614
Outstanding Balance
$503,541
Interest Rate
4.62%
Mortgage Type
FHA
Estimated Equity
$275,772
Purchase Details
Closed on
Jul 5, 2017
Sold by
Bubbico Betty J and Mason Betty J
Bought by
Davies Khalisa
Home Financials for this Owner
Home Financials are based on the most recent Mortgage that was taken out on this home.
Original Mortgage
$602,614
Outstanding Balance
$503,541
Interest Rate
4.62%
Mortgage Type
FHA
Estimated Equity
$275,772
Purchase Details
Closed on
Jan 19, 2016
Sold by
Mason Stan E
Bought by
Bubbico Betty J
Create a Home Valuation Report for This Property
The Home Valuation Report is an in-depth analysis detailing your home's value as well as a comparison with similar homes in the area
Home Values in the Area
Average Home Value in this Area
Purchase History
We collect this data history from publicly available records. To have your information removed, we recommend requesting removal directly through your county’s website.
| Date | Buyer | Sale Price | Title Company |
|---|---|---|---|
| Davies Khalisa | -- | Fidelity National Title | |
| Davies Khalisa | $410,000 | Fidelity National Title | |
| Bubbico Betty J | -- | None Available |
Source: Public Records
Mortgage History
We collect this data history from publicly available records. To have your information removed, we recommend requesting removal directly through your county’s website.
| Date | Status | Borrower | Loan Amount |
|---|---|---|---|
| Open | Davies Khalisa | $602,614 |
Source: Public Records
Tax History
| Year | Tax Paid | Tax Assessment Tax Assessment Total Assessment is a certain percentage of the fair market value that is determined by local assessors to be the total taxable value of land and additions on the property. | Land | Improvement |
|---|---|---|---|---|
| 2026 | $5,930 | $765,000 | $558,000 | $207,000 |
| 2025 | $5,526 | $696,400 | $495,000 | $201,400 |
| 2024 | $5,526 | $646,400 | $445,000 | $201,400 |
| 2023 | $6,458 | $830,700 | $600,000 | $230,700 |
| 2022 | $6,023 | $625,600 | $430,000 | $195,600 |
| 2020 | $5,090 | $488,700 | $317,000 | $171,700 |
| 2019 | $4,375 | $433,700 | $265,000 | $168,700 |
| 2018 | $4,040 | $385,500 | $235,000 | $150,500 |
| 2017 | $3,395 | $326,200 | $185,000 | $141,200 |
| 2016 | $3,007 | $297,500 | $165,000 | $132,500 |
| 2015 | $2,768 | $258,900 | $155,000 | $103,900 |
| 2013 | $2,551 | $209,900 | $127,000 | $82,900 |
Source: Public Records
Map
Nearby Homes
- 904 214th Place SW
- 21627 9th Place W
- 412 213th Place SW Unit 21D
- 604 213th St SW
- 21204 8th Place W
- 616 212th St SW
- 418 212th St SW
- 320 213th Place SW
- 1316 216th St SW
- 518 Hubbard Rd
- 1416 218th Place SW
- 22232 4th Place W
- 25 213th Place SW
- 15 213th Place SW
- 33 213th Place SW
- 20733 Elberta Rd
- 20803 9th Place W
- 20920 2nd Ave W Unit A
- 21120 Meridian Place W
- 903 Logan Rd
- 21702 7th Place W
- 21620 7th Place W
- 16031 119th (Lot 7) Place NE
- 21616 7th Place W
- 21629 8th Place W
- 21625 8th Place W
- 21710 7th Place W
- 21700 7th Place W Unit 2
- 21700 7th Place W
- 21707 8th Place W
- 21617 7th Place W
- 21621 8th Place W
- 21621 8th Place W
- 21709 8th Place W
- 243 7th Place W
- 21718 7th Place W
- 21621 7th Place W
- 720 216th St SW
- 714 216th St SW
- 802 216th St SW
Your Personal Tour Guide
Ask me questions while you tour the home.