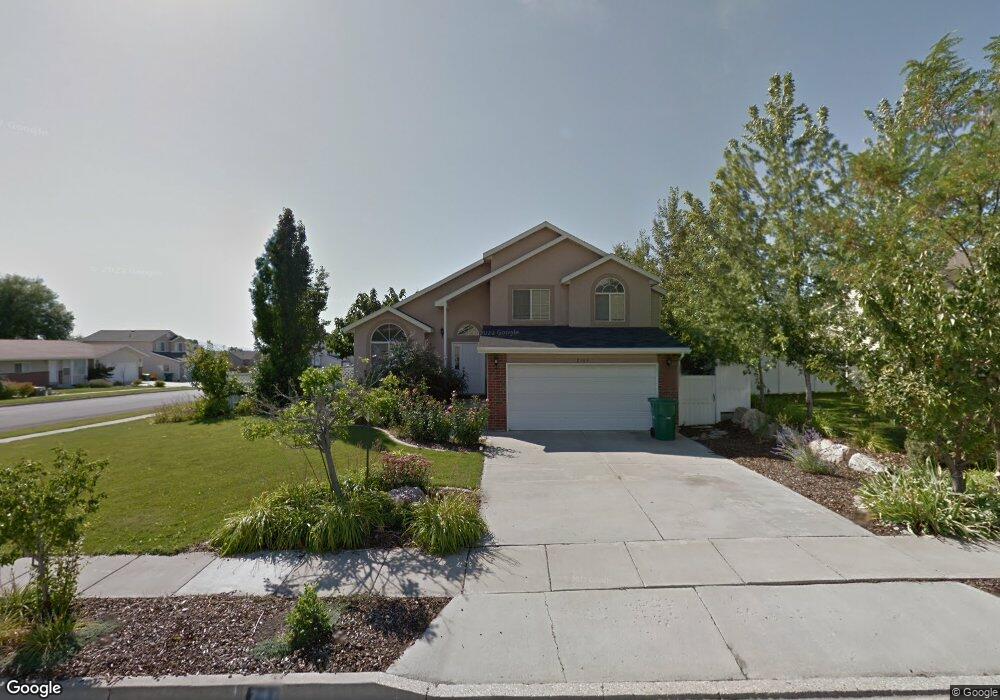
2163 N 10 W Layton, UT 84041
Estimated Value: $480,557 - $511,000
3
Beds
3
Baths
2,024
Sq Ft
$246/Sq Ft
Est. Value
About This Home
This home is located at 2163 N 10 W, Layton, UT 84041 and is currently estimated at $497,139, approximately $245 per square foot. 2163 N 10 W is a home located in Davis County with nearby schools including Lincoln Elementary School, North Layton Junior High School, and Northridge High School.
Ownership History
Date
Name
Owned For
Owner Type
Purchase Details
Closed on
Feb 18, 2014
Sold by
Wen Qiu
Bought by
Wen Qiu and Wen Rui
Current Estimated Value
Home Financials for this Owner
Home Financials are based on the most recent Mortgage that was taken out on this home.
Original Mortgage
$158,719
Outstanding Balance
$120,543
Interest Rate
4.47%
Mortgage Type
New Conventional
Estimated Equity
$376,596
Purchase Details
Closed on
Jul 31, 2000
Sold by
Glen Haney Carpentry Inc
Bought by
Gourley Candice
Home Financials for this Owner
Home Financials are based on the most recent Mortgage that was taken out on this home.
Original Mortgage
$127,415
Interest Rate
12.7%
Purchase Details
Closed on
Feb 3, 2000
Sold by
Antelope Ridge Inc
Bought by
Glen Haney Carpentry Inc
Home Financials for this Owner
Home Financials are based on the most recent Mortgage that was taken out on this home.
Original Mortgage
$119,200
Interest Rate
7.96%
Create a Home Valuation Report for This Property
The Home Valuation Report is an in-depth analysis detailing your home's value as well as a comparison with similar homes in the area
Home Values in the Area
Average Home Value in this Area
Purchase History
| Date | Buyer | Sale Price | Title Company |
|---|---|---|---|
| Wen Qiu | -- | Cornerstone Title Ins | |
| Wen Qiu | -- | Mountain View Title & | |
| Gourley Candice | -- | First American Title Co | |
| Glen Haney Carpentry Inc | -- | Associated Title Company |
Source: Public Records
Mortgage History
| Date | Status | Borrower | Loan Amount |
|---|---|---|---|
| Open | Wen Qiu | $158,719 | |
| Previous Owner | Gourley Candice | $127,415 | |
| Previous Owner | Glen Haney Carpentry Inc | $119,200 | |
| Closed | Gourley Candice | $14,990 |
Source: Public Records
Tax History Compared to Growth
Tax History
| Year | Tax Paid | Tax Assessment Tax Assessment Total Assessment is a certain percentage of the fair market value that is determined by local assessors to be the total taxable value of land and additions on the property. | Land | Improvement |
|---|---|---|---|---|
| 2025 | $2,440 | $229,350 | $96,159 | $133,191 |
| 2024 | $2,306 | $219,450 | $112,089 | $107,361 |
| 2023 | $2,342 | $398,000 | $133,677 | $264,323 |
| 2022 | $2,389 | $222,200 | $70,552 | $151,648 |
| 2021 | $2,204 | $305,000 | $98,635 | $206,365 |
| 2020 | $1,996 | $264,000 | $83,133 | $180,867 |
| 2019 | $2,016 | $264,000 | $79,084 | $184,916 |
| 2018 | $1,884 | $247,000 | $79,084 | $167,916 |
| 2016 | $1,670 | $115,390 | $25,176 | $90,214 |
| 2015 | $1,693 | $111,705 | $25,176 | $86,529 |
| 2014 | $1,615 | $109,114 | $25,176 | $83,938 |
| 2013 | -- | $106,975 | $31,020 | $75,955 |
Source: Public Records
Map
Nearby Homes
- 9 W 2150 N
- 23 E 2150 N
- 2048 Evans Cove Loop
- 2044 Evans Cove Loop
- 1966 N 50 W
- 95 W 2400 N
- 1908 N 200 W
- 2500 N Fort Ln Unit 189
- 2500 N Fort Ln Unit 238
- 2600 N Hill Field Rd Unit 138
- 2600 N Hill Field Rd Unit 4
- 2248 N 500 W
- 2211 N 525 W
- 1837 N 440 W
- 14 Lakeview Dr
- 398 Paul Ave
- 254 Fremont Way
- 414 E 2625 N
- 203 Darlington Way
- 2378 N 675 W