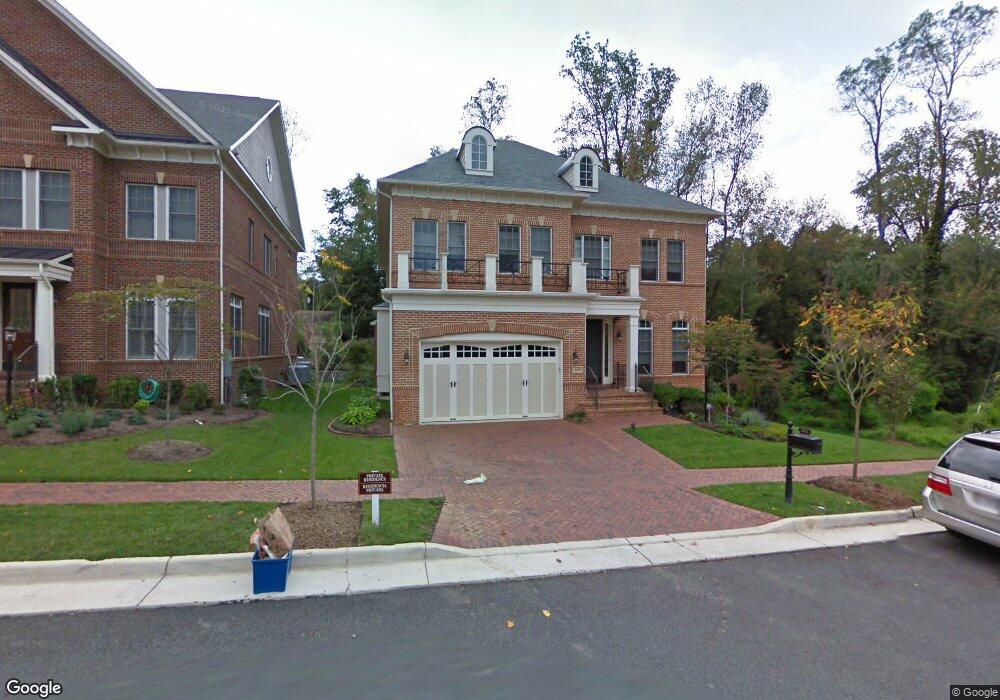
2163 Royal Lodge Dr Falls Church, VA 22043
Estimated Value: $1,906,281 - $2,167,000
4
Beds
5
Baths
4,076
Sq Ft
$500/Sq Ft
Est. Value
About This Home
This home is located at 2163 Royal Lodge Dr, Falls Church, VA 22043 and is currently estimated at $2,037,820, approximately $499 per square foot. 2163 Royal Lodge Dr is a home located in Fairfax County with nearby schools including Haycock Elementary School, Longfellow Middle School, and St. James Catholic School.
Ownership History
Date
Name
Owned For
Owner Type
Purchase Details
Closed on
Sep 25, 2007
Sold by
Winchester Homes Inc
Bought by
Fishman Simon
Current Estimated Value
Home Financials for this Owner
Home Financials are based on the most recent Mortgage that was taken out on this home.
Original Mortgage
$1,100,000
Outstanding Balance
$702,464
Interest Rate
6.65%
Mortgage Type
New Conventional
Estimated Equity
$1,335,356
Create a Home Valuation Report for This Property
The Home Valuation Report is an in-depth analysis detailing your home's value as well as a comparison with similar homes in the area
Home Values in the Area
Average Home Value in this Area
Purchase History
| Date | Buyer | Sale Price | Title Company |
|---|---|---|---|
| Fishman Simon | $1,605,143 | -- |
Source: Public Records
Mortgage History
| Date | Status | Borrower | Loan Amount |
|---|---|---|---|
| Open | Fishman Simon | $1,100,000 |
Source: Public Records
Tax History Compared to Growth
Tax History
| Year | Tax Paid | Tax Assessment Tax Assessment Total Assessment is a certain percentage of the fair market value that is determined by local assessors to be the total taxable value of land and additions on the property. | Land | Improvement |
|---|---|---|---|---|
| 2025 | $20,556 | $1,781,970 | $636,000 | $1,145,970 |
| 2024 | $20,556 | $1,739,780 | $624,000 | $1,115,780 |
| 2023 | $19,796 | $1,719,120 | $624,000 | $1,095,120 |
| 2022 | $17,839 | $1,529,240 | $520,000 | $1,009,240 |
| 2021 | $17,667 | $1,476,550 | $507,000 | $969,550 |
| 2020 | $17,112 | $1,418,340 | $507,000 | $911,340 |
| 2019 | $17,939 | $1,486,840 | $563,000 | $923,840 |
| 2018 | $16,536 | $1,437,930 | $541,000 | $896,930 |
| 2017 | $17,025 | $1,437,930 | $541,000 | $896,930 |
| 2016 | $16,114 | $1,363,870 | $541,000 | $822,870 |
| 2015 | $15,079 | $1,323,900 | $525,000 | $798,900 |
| 2014 | $15,046 | $1,323,900 | $525,000 | $798,900 |
Source: Public Records
Map
Nearby Homes
- 6712 Moly Dr
- 6616 Kirby Ct
- 2202 Grayson Place
- 6610 Quinten St
- 6609 Rockmont Ct
- 6616 Fisher Ave
- 2221 Orchid Dr
- 2118 Greenwich St
- 6607 Midhill Place
- 6613 Fisher Ave
- 6975 Idylwood Rd
- 6927 Haycock Rd
- 2240 Highland Terrace
- 2125 Hilltop Place
- 2300 Meridian St
- 6703 Hallwood Ave
- 6601 Gordon Ave
- 2005 Highboro Way
- 6990 Falls Reach Dr Unit 313
- 2302 Westmoreland St
- 2161 Royal Lodge Dr
- 2159 Royal Lodge Dr
- 2160 Royal Lodge Dr
- 6724 Montour Dr
- 6728 Montour Dr
- 2157 Royal Lodge Dr
- 6800 Crutchfield St
- 2158 Royal Lodge Dr
- 6720 Montour Dr
- 6801 Crutchfield St
- 6732 Montour Dr
- 1 Sprague Ave
- 1 Sprague Ave
- 2155 Royal Lodge Dr
- 2156 Royal Lodge Dr
- 6799 Stockwell Manor Dr
- 6804 Crutchfield St
- 6795 Stockwell Manor Dr
- 2154 Royal Lodge Dr
- 6736 Montour Dr