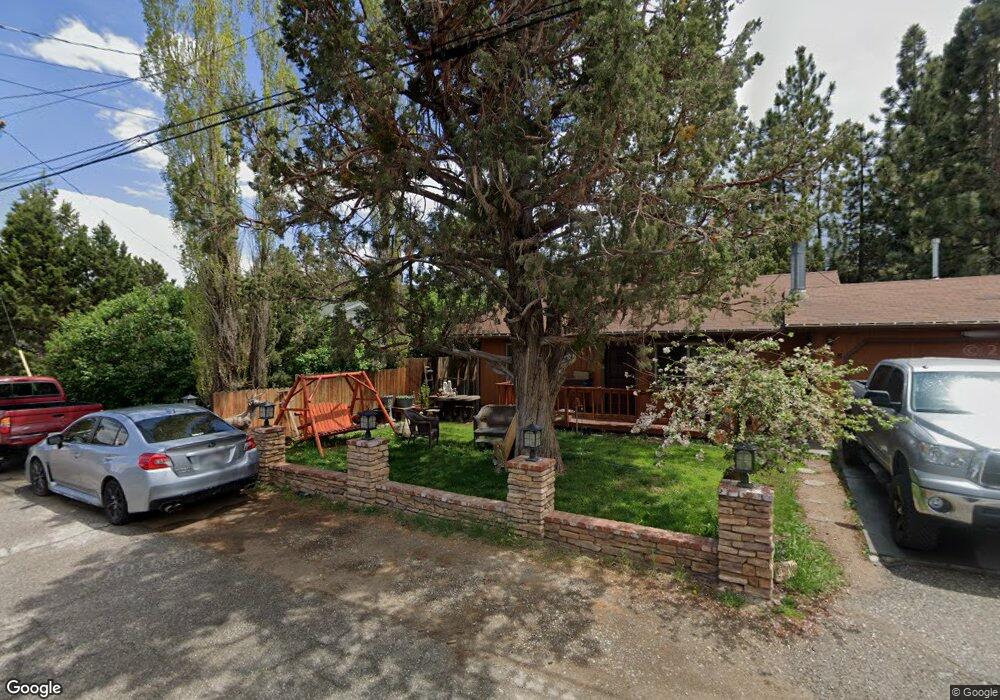
2165 3rd Ln Big Bear City, CA 92314
Estimated Value: $228,000 - $239,000
2
Beds
1
Bath
900
Sq Ft
$257/Sq Ft
Est. Value
About This Home
This home is located at 2165 3rd Ln, Big Bear City, CA 92314 and is currently estimated at $231,336, approximately $257 per square foot. 2165 3rd Ln is a home located in San Bernardino County with nearby schools including Baldwin Lane Elementary School, Big Bear Middle School, and Big Bear High School.
Ownership History
Date
Name
Owned For
Owner Type
Purchase Details
Closed on
Jan 26, 2002
Sold by
Dixie Horskotte Daniel
Bought by
Loy David
Current Estimated Value
Home Financials for this Owner
Home Financials are based on the most recent Mortgage that was taken out on this home.
Original Mortgage
$65,975
Outstanding Balance
$24,796
Interest Rate
6.8%
Mortgage Type
FHA
Estimated Equity
$206,540
Purchase Details
Closed on
Nov 18, 1993
Sold by
Duffin Charles M
Bought by
Horstkotte Daniel and Horstkotte Dixie
Create a Home Valuation Report for This Property
The Home Valuation Report is an in-depth analysis detailing your home's value as well as a comparison with similar homes in the area
Home Values in the Area
Average Home Value in this Area
Purchase History
We collect this data history from publicly available records. To have your information removed, we recommend requesting removal directly through your county’s website.
| Date | Buyer | Sale Price | Title Company |
|---|---|---|---|
| Loy David | $67,000 | First American Title | |
| Horstkotte Daniel | -- | First American Title Ins Co |
Source: Public Records
Mortgage History
We collect this data history from publicly available records. To have your information removed, we recommend requesting removal directly through your county’s website.
| Date | Status | Borrower | Loan Amount |
|---|---|---|---|
| Open | Loy David | $65,975 |
Source: Public Records
Tax History
| Year | Tax Paid | Tax Assessment Tax Assessment Total Assessment is a certain percentage of the fair market value that is determined by local assessors to be the total taxable value of land and additions on the property. | Land | Improvement |
|---|---|---|---|---|
| 2025 | $2,329 | $98,390 | $14,774 | $83,616 |
| 2024 | $2,209 | $96,460 | $14,484 | $81,976 |
| 2023 | $2,119 | $94,569 | $14,200 | $80,369 |
| 2022 | $2,020 | $92,715 | $13,922 | $78,793 |
| 2021 | $1,968 | $90,897 | $13,649 | $77,248 |
| 2020 | $1,951 | $89,965 | $13,509 | $76,456 |
| 2019 | $1,907 | $88,201 | $13,244 | $74,957 |
| 2018 | $1,831 | $86,471 | $12,984 | $73,487 |
| 2017 | $1,776 | $84,775 | $12,729 | $72,046 |
| 2016 | $1,729 | $83,112 | $12,479 | $70,633 |
| 2015 | $1,695 | $81,864 | $12,292 | $69,572 |
| 2014 | $1,662 | $80,260 | $12,051 | $68,209 |
Source: Public Records
Map
Nearby Homes
Your Personal Tour Guide
Ask me questions while you tour the home.