
Seller's Agent in 2026
Matthew Brown
Tom Hayes Realty
(765) 210-2959
92 Total Sales
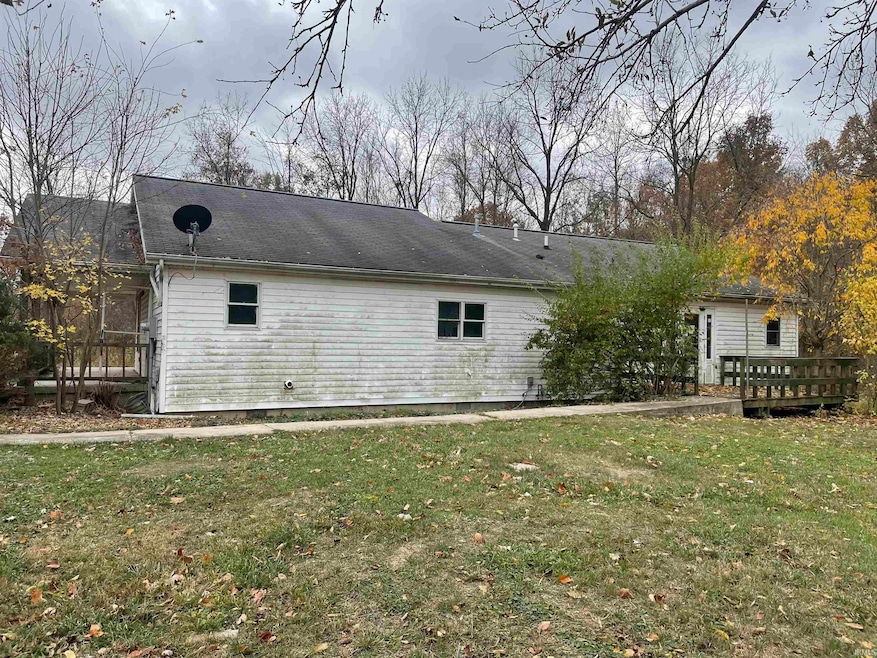
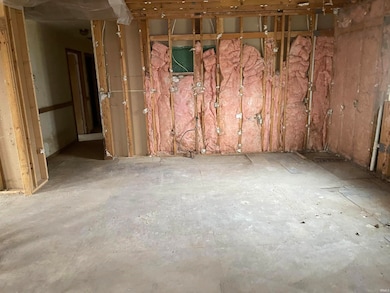
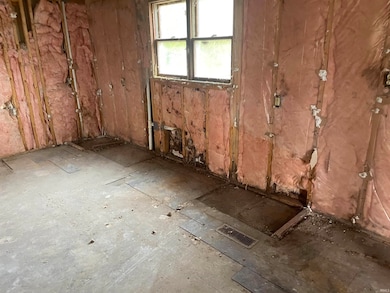
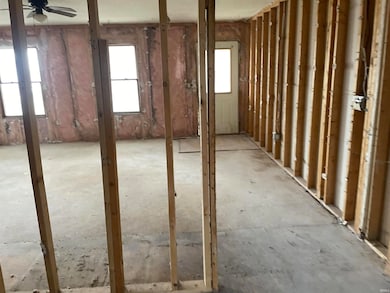
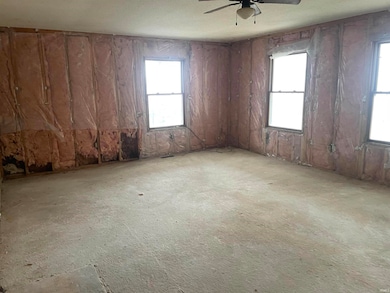
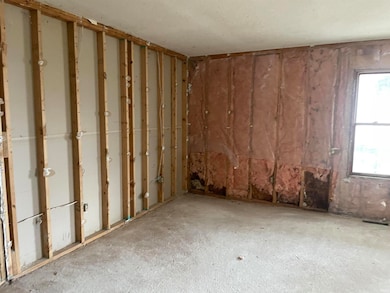
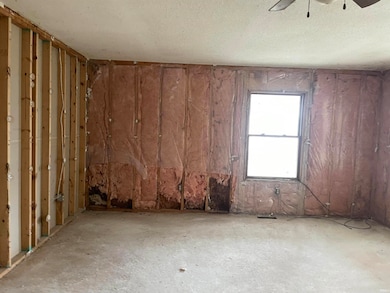
This large home has potential with 1792 sq ft on a large 2-acre lot. Deck and covered porch and a pole barn. DO NOT trespass on property to the east which is 2165 E 400 S LOT 1. Property has multiple offers. Highest and best offers are due by 10 AM Jan. 2, 2026.
Last Agent to Sell the Property
Tom Hayes Realty Brokerage Phone: 765-210-2959 Listed on: 11/13/2025
| Date | Type | Sale Price | Title Company |
|---|---|---|---|
| Special Warranty Deed | $95,000 | None Listed On Document | |
| Sheriffs Deed | $111,091 | None Listed On Document | |
| Special Warranty Deed | -- | -- | |
| Sheriffs Deed | $50,000 | -- | |
| Corporate Deed | -- | -- | |
| Corporate Deed | -- | -- | |
| Sheriffs Deed | $293,508 | -- |
| Date | Status | Loan Amount | Loan Type |
|---|---|---|---|
| Previous Owner | $32,000 | Commercial | |
| Previous Owner | $75,000 | Adjustable Rate Mortgage/ARM | |
| Previous Owner | $135,000 | Adjustable Rate Mortgage/ARM |
| Date | Event | Price | List to Sale | Price per Sq Ft |
|---|---|---|---|---|
| 02/10/2026 02/10/26 | Sold | $95,000 | +26.8% | $53 / Sq Ft |
| 01/09/2026 01/09/26 | Pending | -- | -- | -- |
| 12/30/2025 12/30/25 | Price Changed | $74,900 | -16.7% | $42 / Sq Ft |
| 12/29/2025 12/29/25 | For Sale | $89,900 | -5.4% | $50 / Sq Ft |
| 12/25/2025 12/25/25 | Off Market | $95,000 | -- | -- |
| 11/13/2025 11/13/25 | For Sale | $89,900 | -- | $50 / Sq Ft |
| Year | Tax Paid | Tax Assessment Tax Assessment Total Assessment is a certain percentage of the fair market value that is determined by local assessors to be the total taxable value of land and additions on the property. | Land | Improvement |
|---|---|---|---|---|
| 2025 | $2,591 | $219,700 | $27,500 | $192,200 |
| 2024 | $2,591 | $187,100 | $27,500 | $159,600 |
| 2023 | $2,551 | $187,200 | $27,500 | $159,700 |
| 2022 | $859 | $172,500 | $27,500 | $145,000 |
| 2021 | $804 | $154,200 | $23,100 | $131,100 |
| 2020 | $728 | $145,600 | $23,100 | $122,500 |
| 2019 | $644 | $137,600 | $23,100 | $114,500 |
| 2018 | $627 | $134,500 | $23,100 | $111,400 |
| 2017 | $606 | $134,700 | $23,100 | $111,600 |
| 2016 | $481 | $135,100 | $23,100 | $112,000 |
| 2014 | $391 | $130,800 | $23,100 | $107,700 |
| 2013 | $343 | $126,700 | $23,100 | $103,600 |
Seller's Agent in 2026
Matthew Brown
Tom Hayes Realty
(765) 210-2959
92 Total Sales
Buyer's Agent in 2026
Billie Shively
eXp Realty, LLC
(260) 519-1430
107 Total Sales
Source: Indiana Regional MLS
MLS Number: 202545888
APN: 85-15-28-100-002.000-007
Disclaimer: Certain information contained herein is derived from information provided by parties other than Homes.com. All information provided is deemed reliable, but is not guaranteed to be accurate and should be independently verified.
![]() Based on information submitted to the MLS GRID. All data is obtained from various sources and may not have been verified by broker or MLS GRID. Supplied Open House Information is subject to change without notice. All information should be independently reviewed and verified for accuracy. Properties may or may not be listed by the office/agent presenting the information. Some IDX listings have been excluded from this website. IDX information is provided exclusively for personal, non-commercial use, and may not be used for any purpose other than to identify prospective properties consumers may be interested in purchasing. Information is deemed reliable but not guaranteed.
Based on information submitted to the MLS GRID. All data is obtained from various sources and may not have been verified by broker or MLS GRID. Supplied Open House Information is subject to change without notice. All information should be independently reviewed and verified for accuracy. Properties may or may not be listed by the office/agent presenting the information. Some IDX listings have been excluded from this website. IDX information is provided exclusively for personal, non-commercial use, and may not be used for any purpose other than to identify prospective properties consumers may be interested in purchasing. Information is deemed reliable but not guaranteed.
Based on information submitted to the MLS GRID
Ask me questions while you tour the home.