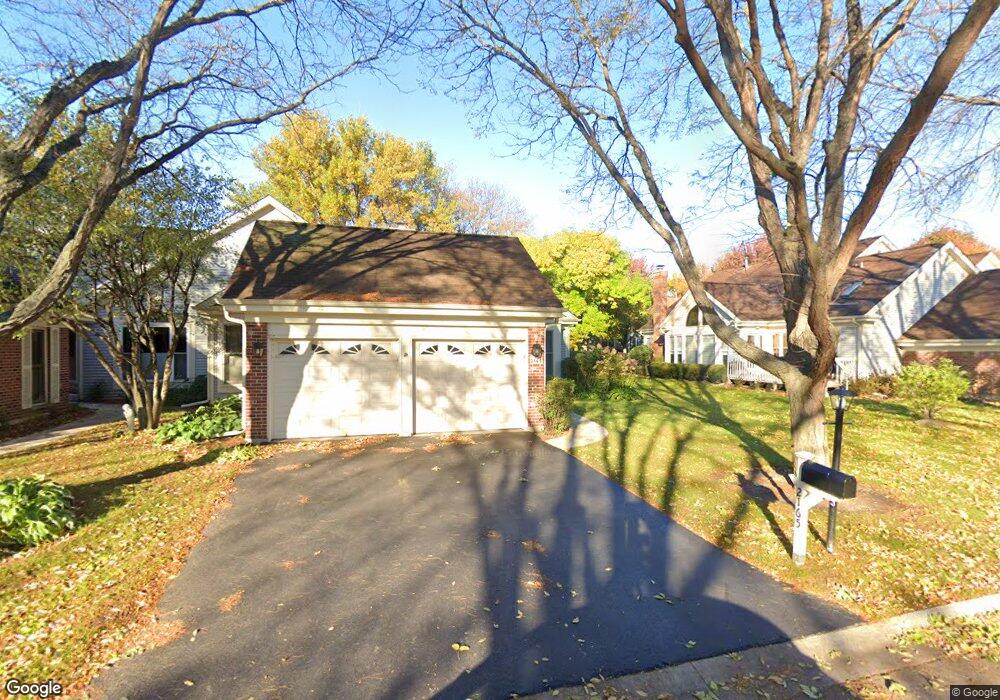
2165 N Lake Shore Cir Arlington Heights, IL 60004
Ivy Hill NeighborhoodEstimated Value: $442,000 - $576,327
2
Beds
2
Baths
1,656
Sq Ft
$323/Sq Ft
Est. Value
About This Home
This home is located at 2165 N Lake Shore Cir, Arlington Heights, IL 60004 and is currently estimated at $535,082, approximately $323 per square foot. 2165 N Lake Shore Cir is a home located in Cook County with nearby schools including Dwight D Eisenhower Elementary School, Anne Sullivan Elementary School, and Betsy Ross Elementary School.
Ownership History
Date
Name
Owned For
Owner Type
Purchase Details
Closed on
Sep 9, 2021
Sold by
Ernst Thomas W and Thomas W Ernst Revocable Trust
Bought by
Ryder Gregory C and Ryder Nancy N
Current Estimated Value
Home Financials for this Owner
Home Financials are based on the most recent Mortgage that was taken out on this home.
Original Mortgage
$375,000
Outstanding Balance
$343,449
Interest Rate
3.25%
Mortgage Type
New Conventional
Estimated Equity
$191,633
Purchase Details
Closed on
Dec 18, 2012
Sold by
Ernst Thomas W
Bought by
Ernst Thomas W and Thomas W Ernst Revocable Trust
Purchase Details
Closed on
Jun 6, 2003
Sold by
Ernst Thomas W and Ernst Linda D
Bought by
Ernst Thomas W and Thomas W Ernst Revocable Trust
Purchase Details
Closed on
May 21, 2003
Sold by
Lasalle Bank Na
Bought by
Ernst Thomas W and Ernst Linda D
Purchase Details
Closed on
Sep 24, 1996
Sold by
Russell John J and Russell Carole J
Bought by
American National Bk & Tr Co Of Chicago and Trust #6341-Pr
Create a Home Valuation Report for This Property
The Home Valuation Report is an in-depth analysis detailing your home's value as well as a comparison with similar homes in the area
Home Values in the Area
Average Home Value in this Area
Purchase History
| Date | Buyer | Sale Price | Title Company |
|---|---|---|---|
| Ryder Gregory C | $500,000 | Chicago Title | |
| Ernst Thomas W | -- | None Available | |
| Ernst Thomas W | -- | -- | |
| Ernst Thomas W | $375,000 | St | |
| American National Bk & Tr Co Of Chicago | -- | -- |
Source: Public Records
Mortgage History
| Date | Status | Borrower | Loan Amount |
|---|---|---|---|
| Open | Ryder Gregory C | $375,000 |
Source: Public Records
Tax History Compared to Growth
Tax History
| Year | Tax Paid | Tax Assessment Tax Assessment Total Assessment is a certain percentage of the fair market value that is determined by local assessors to be the total taxable value of land and additions on the property. | Land | Improvement |
|---|---|---|---|---|
| 2024 | $12,027 | $44,000 | $7,000 | $37,000 |
| 2023 | $11,484 | $44,000 | $7,000 | $37,000 |
| 2022 | $11,484 | $44,000 | $7,000 | $37,000 |
| 2021 | $10,948 | $36,016 | $6,345 | $29,671 |
| 2020 | $10,656 | $36,016 | $6,345 | $29,671 |
| 2019 | $9,023 | $40,287 | $6,345 | $33,942 |
| 2018 | $7,799 | $32,967 | $5,576 | $27,391 |
| 2017 | $7,748 | $32,967 | $5,576 | $27,391 |
| 2016 | $7,700 | $32,967 | $5,576 | $27,391 |
| 2015 | $6,100 | $25,021 | $4,807 | $20,214 |
| 2014 | $6,063 | $25,021 | $4,807 | $20,214 |
| 2013 | $5,897 | $25,021 | $4,807 | $20,214 |
Source: Public Records
Map
Nearby Homes
- 2060 N Charter Point Dr Unit 14
- 1964 N Coldspring Rd Unit 52
- 1949 N Charter Point Dr Unit 1949
- 1956 N Lake Arlington Dr
- 1912 N Coldspring Rd Unit 96
- 1044 Creekside Ct Unit 2B
- 307 Anne Ct
- 1500 Harbour Dr Unit 1D
- 1500 Harbour Dr Unit 2K
- 2143 E Peachtree Ln
- 1054 Harbour Ct Unit 1A
- 1038 Harbour Ct Unit 2A
- 412 Cherry Creek Ln
- 1925 E Waverly Ln
- 21 E Stonegate Dr
- 2616 N Prindle Ave
- 1424 E Jonquil Cir
- 2409 E Greshan Ct
- 11 W Palatine Rd
- 791 Lakeside Circle Dr Unit 1
- 2173 N Lake Shore Cir
- 2163 N Lake Shore Cir
- 2140 N Lake Shore Cir
- 2175 N Lake Shore Cir
- 2174 N Lake Shore Cir
- 2142 N Lake Shore Cir
- 2177 N Lake Shore Cir
- 2167 N Lake Shore Cir
- 2176 N Lake Shore Cir
- 2179 N Lake Shore Cir
- 2157 N Lake Shore Cir
- 2231 N Lake Shore Cir
- 2233 N Lake Shore Cir
- 2182 N Lake Shore Cir
- 2187 N Lake Shore Cir
- 2136 N Lake Shore Cir
- 2147 N Lake Shore Cir
- 2184 N Lake Shore Cir
- 2197 N Lake Shore Cir Unit 3
- 2138 N Lake Shore Cir