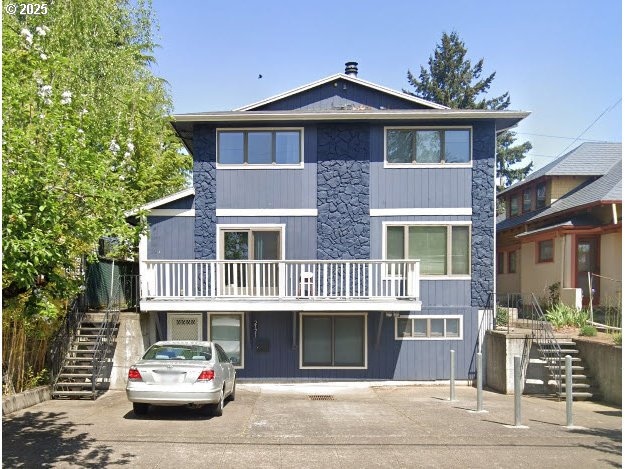
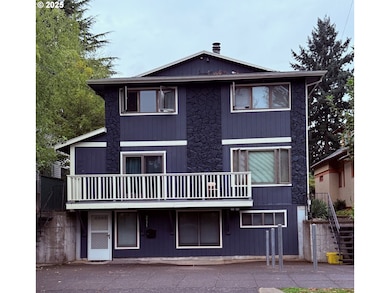
2165 NE Multnomah St Unit 2169 Portland, OR 97232
Sullivan's Gulch NeighborhoodEstimated payment $7,088/month
Highlights
- No HOA
- Landscaped
- Level Lot
- Irvington Elementary School Rated 10
- Baseboard Heating
About This Home
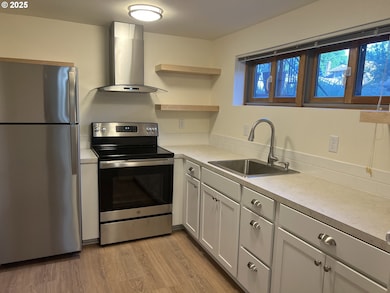
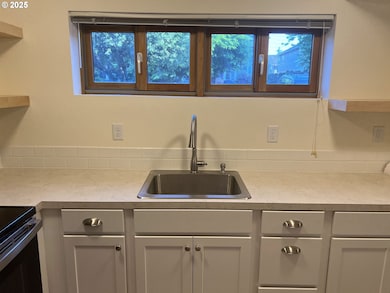
Ideally situated in the highly sought-after Sullivan’s Gulch neighborhood—just south of NE Broadway’s coffee shops, restaurants, boutiques, and light rail—this four-unit property combines strong rental income with an unbeatable location. Tenants love the spacious, townhouse-style layouts, private outdoor spaces, in-unit laundry, decks/patios & off-street parking. Brand new Studio unit was added in 2023, equipped with Sprinkler System. With reliable renters and a proven income record, this is a rare opportunity to own a stable, low-maintenance investment in one of Portland’s most desirable close-in locations. Please do not disturb the tenants.
Listing Agent
Township Properties Real Estate LLC License #200012037 Listed on: 11/20/2025
Property Details
Home Type
- Multi-Family
Est. Annual Taxes
- $16,933
Year Built
- Built in 1975 | Remodeled
Lot Details
- 5,227 Sq Ft Lot
- Lot Dimensions are 50' x 100'
- Landscaped
- Level Lot
Home Design
- Composition Roof
- Plywood Siding Panel T1-11
- Stone Siding
- Cedar
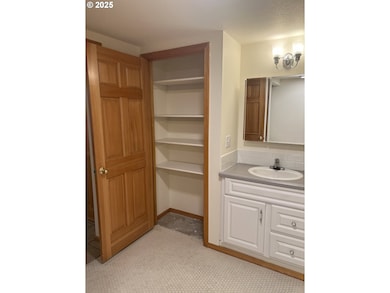
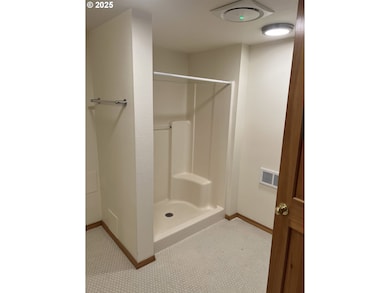
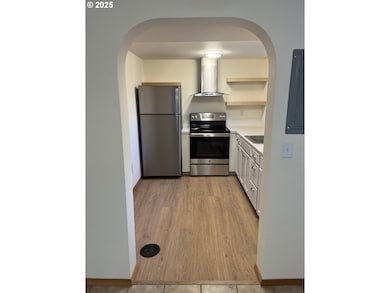
Interior Spaces
- 4,552 Sq Ft Home
- 3-Story Property
Bedrooms and Bathrooms
- 7 Bedrooms
- 8 Bathrooms
Finished Basement
- Basement Storage
- Natural lighting in basement
Parking
- 2 Parking Spaces
- Off-Street Parking
- Assigned Parking
Schools
- Irvington Elementary School
- Harriet Tubman Middle School
- Jefferson High School
Utilities
- No Cooling
- Baseboard Heating
- Electric Water Heater
Listing and Financial Details
- Assessor Parcel Number R181857
Community Details
Overview
- No Home Owners Association
- 4 Units
- Sullivan's Gulch Subdivision
Building Details
- Operating Expense $33,237
- Gross Income $92,520
- Net Operating Income $56,507
Map
Home Values in the Area
Average Home Value in this Area
Tax History
| Year | Tax Paid | Tax Assessment Tax Assessment Total Assessment is a certain percentage of the fair market value that is determined by local assessors to be the total taxable value of land and additions on the property. | Land | Improvement |
|---|---|---|---|---|
| 2025 | $17,488 | $651,860 | -- | -- |
| 2024 | $16,933 | $632,880 | -- | -- |
| 2023 | $16,282 | $614,450 | $0 | $0 |
| 2022 | $15,930 | $596,560 | $0 | $0 |
| 2021 | $15,660 | $579,190 | $0 | $0 |
| 2020 | $14,366 | $562,330 | $0 | $0 |
| 2019 | $13,838 | $545,960 | $0 | $0 |
| 2018 | $13,431 | $530,060 | $0 | $0 |
| 2017 | $12,872 | $514,630 | $0 | $0 |
| 2016 | $11,781 | $499,650 | $0 | $0 |
| 2015 | $11,471 | $485,100 | $0 | $0 |
| 2014 | $11,298 | $470,980 | $0 | $0 |
Property History
| Date | Event | Price | List to Sale | Price per Sq Ft | Prior Sale |
|---|---|---|---|---|---|
| 11/20/2025 11/20/25 | For Sale | $1,075,000 | +30.3% | $236 / Sq Ft | |
| 01/31/2020 01/31/20 | Sold | $825,000 | -10.8% | $196 / Sq Ft | View Prior Sale |
| 12/24/2019 12/24/19 | Pending | -- | -- | -- | |
| 09/26/2019 09/26/19 | For Sale | $924,450 | -- | $219 / Sq Ft |
Purchase History
| Date | Type | Sale Price | Title Company |
|---|---|---|---|
| Warranty Deed | $825,000 | Old Republic Title Co Of Or | |
| Interfamily Deed Transfer | -- | None Available |
Mortgage History
| Date | Status | Loan Amount | Loan Type |
|---|---|---|---|
| Open | $618,750 | New Conventional |
Source: Regional Multiple Listing Service (RMLS)
MLS Number: 234723779
APN: R181857
Disclaimer: Certain information contained herein is derived from information provided by parties other than Homes.com. All information provided is deemed reliable, but is not guaranteed to be accurate and should be independently verified.
![]() The content relating to real estate for sale on this web site comes in part from the IDX program of the RMLS™ of Portland, Oregon. Real estate listings held by brokerage firms other than Ten-X are marked with the RMLS™ logo, and detailed information about these properties includes the names of the listing brokers. Listing content is copyright © 2025 RMLS™, Portland, Oregon. Some properties which appear for sale on this web site may subsequently have sold or may no longer be available. All information provided is deemed reliable but is not guaranteed and should be independently verified.
The content relating to real estate for sale on this web site comes in part from the IDX program of the RMLS™ of Portland, Oregon. Real estate listings held by brokerage firms other than Ten-X are marked with the RMLS™ logo, and detailed information about these properties includes the names of the listing brokers. Listing content is copyright © 2025 RMLS™, Portland, Oregon. Some properties which appear for sale on this web site may subsequently have sold or may no longer be available. All information provided is deemed reliable but is not guaranteed and should be independently verified.
- 1406 NE 21st Ave
- 1415 NE 21st Ave Unit 11
- 1823 NE Multnomah St Unit 21
- 2226 NE Weidler St
- 1827 NE Multnomah St Unit 22
- 1220 NE 17th Ave Unit 12B
- 1220 NE 17th Ave Unit 5A
- 1220 NE 17th Ave Unit 4C
- 711 NE Randall Ave Unit 203
- 1620 NE Broadway St Unit 206
- 1620 NE Broadway St Unit 540
- 1620 NE Broadway St Unit 232
- 2536 NE Hoyt St Unit 2540
- 2544 NE Hoyt St Unit 2548
- 623 NE Randall Ave
- 2758 NE Schuyler St
- 1845 NE Tillamook St
- 1927 NE 16th Ave
- 2225 NE 24th Ave
- 2324 NE Thompson St
- 2020 NE Multnomah St
- 2028 NE Clackamas St
- 925 NE 23rd Ave Unit ID1309836P
- 925 NE 23rd Ave Unit ID1309839P
- 925 NE 23rd Ave Unit ID1309841P
- 925 NE 23rd Ave Unit ID1309832P
- 925 NE 23rd Ave Unit ID1309874P
- 1529 NE 21st Ave
- 2050 NE Pacific St
- 1710 NE Multnomah St
- 875 NE 27th Ave
- 620 NE 20th Ave
- 2510 NE Sandy Blvd
- 2050 NE Hoyt St
- 1620 NE Broadway St Unit 530
- 1620 NE Broadway St Unit 306
- 2865 NE Sandy Blvd
- 1640 NE Irving St
- 2034 NE Flanders St Unit ID1309886P
- 2516 NE Flanders St
