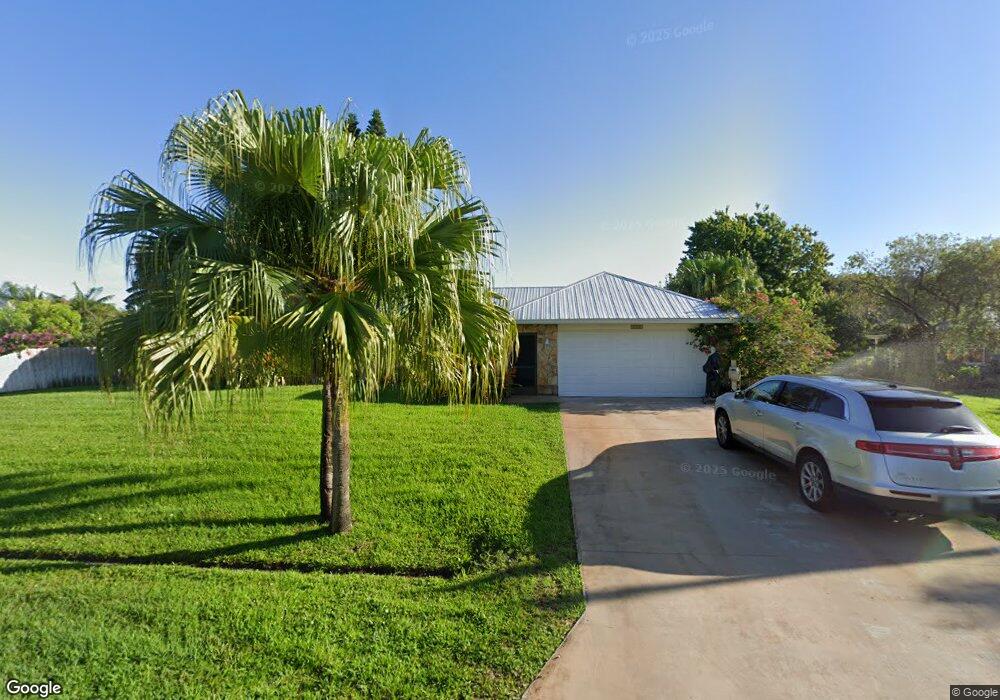
2165 SE van Kleff Ave Port Saint Lucie, FL 34952
Sandpiper Bay NeighborhoodEstimated Value: $377,000 - $513,000
3
Beds
2
Baths
1,759
Sq Ft
$248/Sq Ft
Est. Value
About This Home
This home is located at 2165 SE van Kleff Ave, Port Saint Lucie, FL 34952 and is currently estimated at $435,757, approximately $247 per square foot. 2165 SE van Kleff Ave is a home located in St. Lucie County with nearby schools including Morningside Elementary School, Mariposa Elementary School, and Floresta Elementary School.
Ownership History
Date
Name
Owned For
Owner Type
Purchase Details
Closed on
Mar 1, 2021
Sold by
Weber Donald A
Bought by
Viera Tedder Rosemary A and Tedder Charles E
Current Estimated Value
Home Financials for this Owner
Home Financials are based on the most recent Mortgage that was taken out on this home.
Original Mortgage
$240,562
Outstanding Balance
$216,371
Interest Rate
2.9%
Mortgage Type
FHA
Estimated Equity
$219,386
Purchase Details
Closed on
Mar 19, 2007
Sold by
Cook Thomas and Cook Olga
Bought by
Weber Donald A
Home Financials for this Owner
Home Financials are based on the most recent Mortgage that was taken out on this home.
Original Mortgage
$260,000
Interest Rate
6.27%
Mortgage Type
Purchase Money Mortgage
Purchase Details
Closed on
Sep 1, 1999
Sold by
Milano Edward and Manuli Nancy
Bought by
Cook Thomas
Home Financials for this Owner
Home Financials are based on the most recent Mortgage that was taken out on this home.
Original Mortgage
$94,500
Interest Rate
7.91%
Create a Home Valuation Report for This Property
The Home Valuation Report is an in-depth analysis detailing your home's value as well as a comparison with similar homes in the area
Home Values in the Area
Average Home Value in this Area
Purchase History
| Date | Buyer | Sale Price | Title Company |
|---|---|---|---|
| Viera Tedder Rosemary A | $245,000 | Suncoast Ttl Of Wellington I | |
| Weber Donald A | $325,000 | Suncoast Title Insurance Age | |
| Cook Thomas | $126,000 | -- |
Source: Public Records
Mortgage History
| Date | Status | Borrower | Loan Amount |
|---|---|---|---|
| Open | Viera Tedder Rosemary A | $240,562 | |
| Previous Owner | Weber Donald A | $260,000 | |
| Previous Owner | Cook Thomas | $94,500 |
Source: Public Records
Tax History Compared to Growth
Tax History
| Year | Tax Paid | Tax Assessment Tax Assessment Total Assessment is a certain percentage of the fair market value that is determined by local assessors to be the total taxable value of land and additions on the property. | Land | Improvement |
|---|---|---|---|---|
| 2024 | $7,282 | $330,364 | -- | -- |
| 2023 | $7,282 | $320,742 | $0 | $0 |
| 2022 | $7,077 | $311,400 | $159,900 | $151,500 |
| 2021 | $6,217 | $236,000 | $98,700 | $137,300 |
| 2020 | $5,760 | $200,500 | $77,100 | $123,400 |
| 2019 | $5,715 | $205,100 | $77,100 | $128,000 |
| 2018 | $5,154 | $187,200 | $61,000 | $126,200 |
| 2017 | $4,886 | $164,100 | $61,000 | $103,100 |
| 2016 | $4,557 | $164,000 | $56,900 | $107,100 |
| 2015 | $4,152 | $130,400 | $40,600 | $89,800 |
| 2014 | $3,721 | $120,000 | $0 | $0 |
Source: Public Records
Map
Nearby Homes
- 2319 NW Sunset Blvd
- 3041 SE Dalhart Rd
- 3034 SE Dalhart Rd
- 3013 SE Darien Rd
- 3068 SE Darien Rd
- 3060 SE Darien Rd
- 3809 NW Mediterranean Ln Unit 104
- 3722 NW Mediterranean Ln Unit 105
- 3655 NW Adriatic Ln Unit 307
- 3769 NW Mediterranean Ln Unit 2-308
- 3688 NW Mediterranean Ln Unit 208
- 3665 NW Adriatic Ln Unit 5-206
- 3720 NW Mediterranean Ln Unit 304
- 2082 SE Pyramid Rd
- 2950 SE Aba St
- 1826 SE Killean Ct
- 2042 SE Pyramid Rd
- 2123 NW Winterberry Trail
- 2802 SE Calvin St
- 1838 SE van Kleff Ave
- 2181 SE van Kleff Ave
- 2149 SE van Kleff Ave
- 2133 SE van Kleff Ave
- 2197 SE van Kleff Ave
- 3074 SE Bakersfield St
- 3056 SE Bakersfield St
- 3098 SE Bur St
- 3038 SE Bakersfield St
- 3074 SE Bur St
- 3020 SE Bakersfield St
- 3026 SE Bur St
- 2101 SE van Kleff Ave
- 3081 SE Dalhart Rd
- 2901 SE Dalhart Rd
- 3071 SE Dalhart Rd Unit 8
- 2902 SE Dalhart Rd
- 3002 SE Bur St
- 3002 SE Bakersfield St
- 2181 SE Bryson Ave
- 3061 SE Dalhart Rd