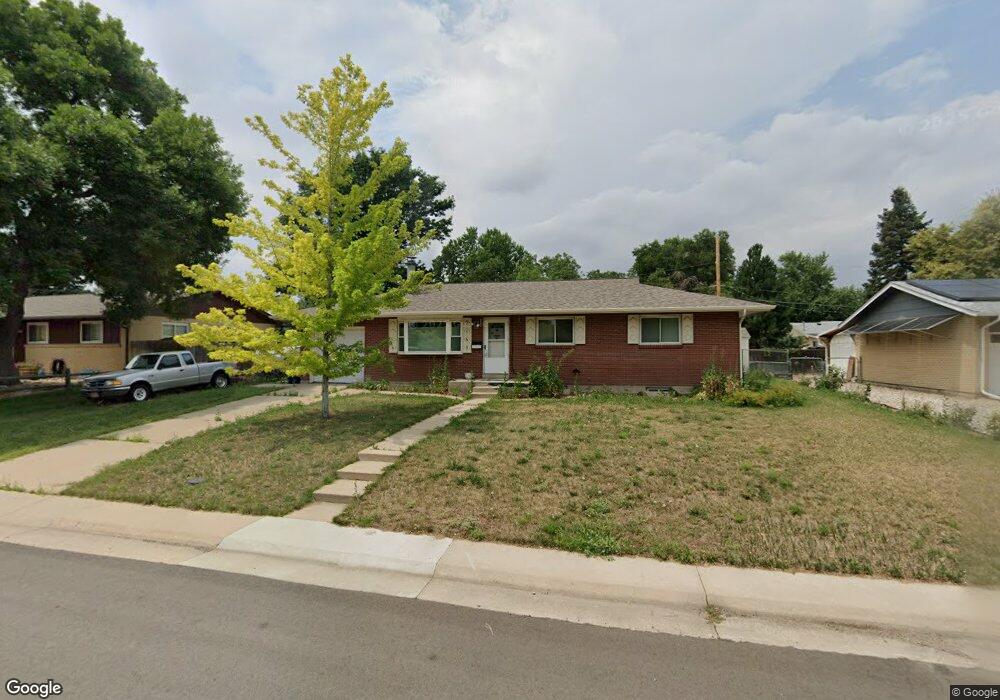
2165 Zang St Golden, CO 80401
Applewood West NeighborhoodEstimated Value: $557,000 - $724,000
3
Beds
3
Baths
1,225
Sq Ft
$519/Sq Ft
Est. Value
About This Home
This home is located at 2165 Zang St, Golden, CO 80401 and is currently estimated at $635,234, approximately $518 per square foot. 2165 Zang St is a home located in Jefferson County with nearby schools including Stober Elementary School, Everitt Middle School, and Wheat Ridge High School.
Ownership History
Date
Name
Owned For
Owner Type
Purchase Details
Closed on
Jul 29, 2016
Sold by
The Erma E Van Meter Living Trust
Bought by
Deane Randall A and Deane Debra M
Current Estimated Value
Home Financials for this Owner
Home Financials are based on the most recent Mortgage that was taken out on this home.
Original Mortgage
$205,875
Outstanding Balance
$164,582
Interest Rate
3.54%
Mortgage Type
VA
Estimated Equity
$470,652
Purchase Details
Closed on
Jun 1, 1999
Sold by
Warren E Vanmeter Living Trust
Bought by
The Erma E Vanmeter Living Trust
Purchase Details
Closed on
Feb 19, 1999
Sold by
We Vanmeter Co
Bought by
The Erma E Vanmeter Living Trust and The Warren E Vanmeter Living Trust
Purchase Details
Closed on
May 16, 1997
Sold by
The Warren E Van Meter Living Trust
Bought by
The Erma E Van Meter Living Trust
Purchase Details
Closed on
Jul 13, 1992
Sold by
Vanmeter Erma and Vanmeter Warren
Bought by
W & E Van Meter & Co
Create a Home Valuation Report for This Property
The Home Valuation Report is an in-depth analysis detailing your home's value as well as a comparison with similar homes in the area
Home Values in the Area
Average Home Value in this Area
Purchase History
| Date | Buyer | Sale Price | Title Company |
|---|---|---|---|
| Deane Randall A | $305,000 | Chicago Title | |
| The Erma E Vanmeter Living Trust | -- | -- | |
| The Erma E Vanmeter Living Trust | -- | -- | |
| The Erma E Van Meter Living Trust | $67,500 | -- | |
| W & E Van Meter & Co | -- | -- |
Source: Public Records
Mortgage History
| Date | Status | Borrower | Loan Amount |
|---|---|---|---|
| Open | Deane Randall A | $205,875 |
Source: Public Records
Tax History Compared to Growth
Tax History
| Year | Tax Paid | Tax Assessment Tax Assessment Total Assessment is a certain percentage of the fair market value that is determined by local assessors to be the total taxable value of land and additions on the property. | Land | Improvement |
|---|---|---|---|---|
| 2024 | $3,390 | $33,658 | $18,554 | $15,104 |
| 2023 | $3,390 | $33,658 | $18,554 | $15,104 |
| 2022 | $3,175 | $30,772 | $13,354 | $17,418 |
| 2021 | $3,716 | $31,657 | $13,738 | $17,919 |
| 2020 | $2,886 | $28,529 | $11,846 | $16,683 |
| 2019 | $2,847 | $28,529 | $11,846 | $16,683 |
| 2018 | $2,639 | $25,738 | $8,698 | $17,040 |
| 2017 | $2,450 | $25,738 | $8,698 | $17,040 |
| 2016 | $2,172 | $21,563 | $6,280 | $15,283 |
| 2015 | $1,975 | $21,563 | $6,280 | $15,283 |
| 2014 | $1,975 | $18,953 | $5,731 | $13,222 |
Source: Public Records
Map
Nearby Homes
- 13017 W 20th Ave Unit C13017
- 12993 W 20th Ave Unit B12993
- 12931 W 20th Ave Unit A12931
- 2101 Youngfield St
- 2128 Applewood Dr
- 2148 Applewood Dr
- 2124 Applewood Dr
- 2118 Applewood Dr
- 2351 Beech Ct
- 2180 Myrtlewood Ln
- 12820 Willow Ln Unit 16
- 2591 Beech Ct
- 1810 Youngfield Ct Unit A
- 2589 Alkire St
- 2590 Braun Dr
- 1880 Applewood Dr
- 2573 Braun Ct
- 13448 W 23rd Place
- 13257 W 26th Ave
- 13000 Willow Ln