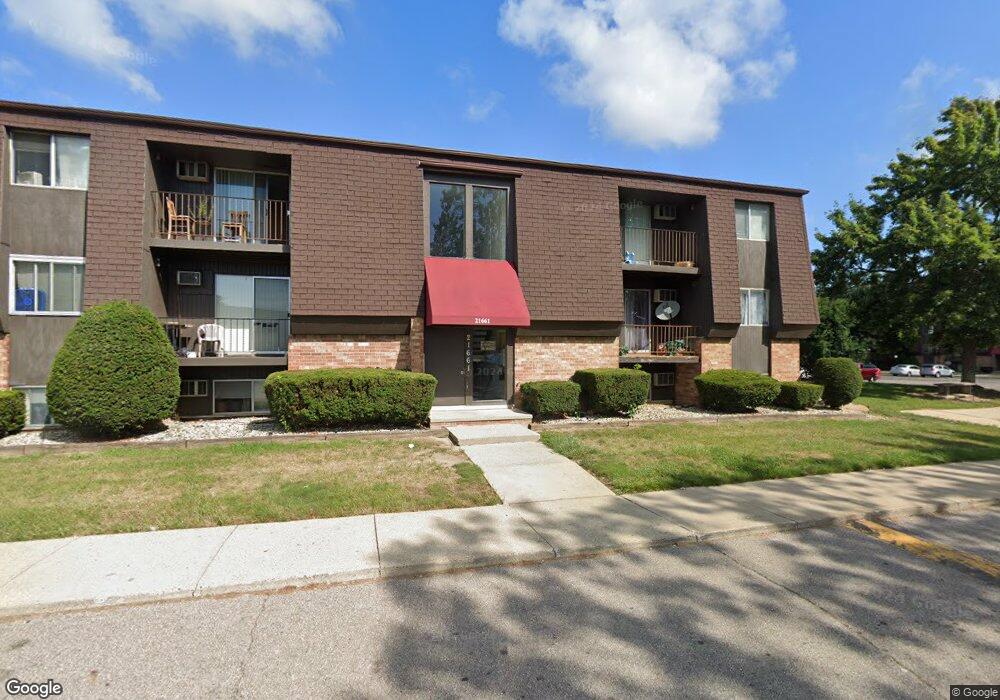
21661 Hillside Dr Unit D2 Clinton Township, MI 48035
Estimated Value: $54,000 - $124,165
--
Bed
1
Bath
715
Sq Ft
$109/Sq Ft
Est. Value
About This Home
This home is located at 21661 Hillside Dr Unit D2, Clinton Township, MI 48035 and is currently estimated at $78,055, approximately $109 per square foot. 21661 Hillside Dr Unit D2 is a home located in Macomb County with nearby schools including Clintondale High School, Faith Christian School, and St. Thecla Catholic School.
Ownership History
Date
Name
Owned For
Owner Type
Purchase Details
Closed on
Oct 30, 2020
Sold by
Batanjski Milorad
Bought by
Hillside Partners Llc
Current Estimated Value
Purchase Details
Closed on
May 29, 2012
Sold by
P & B Management Llc
Bought by
Batanjski Milorad and Batanjski Branislava
Purchase Details
Closed on
May 28, 2012
Sold by
Kluck Robert David and Kluck Robert D
Bought by
P & B Management Llc
Purchase Details
Closed on
Jul 6, 2011
Sold by
Kluck Robert D and Kluck Patricia A
Bought by
P & B Management Llc
Purchase Details
Closed on
Aug 8, 2007
Sold by
Kluck Robert Dennis
Bought by
Kluck Robert David
Purchase Details
Closed on
Jun 24, 2005
Sold by
Mccarthy Daniel J and Mccarthy Patricia D
Bought by
Kluck Robert D
Purchase Details
Closed on
Jun 1, 2005
Sold by
Lewan Alfred R and Lewan Emily
Bought by
Mccarthy Daniel J and Mccarthy Patricia D
Create a Home Valuation Report for This Property
The Home Valuation Report is an in-depth analysis detailing your home's value as well as a comparison with similar homes in the area
Home Values in the Area
Average Home Value in this Area
Purchase History
| Date | Buyer | Sale Price | Title Company |
|---|---|---|---|
| Hillside Partners Llc | $1,292,812 | None Available | |
| Batanjski Milorad | $9,500 | Devon Title Agency | |
| P & B Management Llc | -- | None Available | |
| P & B Management Llc | -- | None Available | |
| Kluck Robert David | -- | None Available | |
| Kluck Robert D | $32,911 | Option Title Agency Inc | |
| Mccarthy Daniel J | $30,000 | Option Title Agency |
Source: Public Records
Tax History Compared to Growth
Tax History
| Year | Tax Paid | Tax Assessment Tax Assessment Total Assessment is a certain percentage of the fair market value that is determined by local assessors to be the total taxable value of land and additions on the property. | Land | Improvement |
|---|---|---|---|---|
| 2025 | $940 | $18,800 | $0 | $0 |
| 2024 | $692 | $16,500 | $0 | $0 |
| 2023 | $657 | $15,000 | $0 | $0 |
| 2022 | $852 | $14,600 | $0 | $0 |
| 2021 | $827 | $12,800 | $0 | $0 |
| 2020 | $302 | $11,400 | $0 | $0 |
| 2019 | $392 | $9,600 | $0 | $0 |
| 2018 | $385 | $8,700 | $0 | $0 |
| 2017 | $379 | $7,100 | $1,500 | $5,600 |
| 2016 | $376 | $7,100 | $0 | $0 |
| 2015 | -- | $5,900 | $0 | $0 |
| 2014 | -- | $5,800 | $0 | $0 |
| 2011 | -- | $9,900 | $0 | $9,900 |
Source: Public Records
Map
Nearby Homes
- 21640 Hillside #3c Dr
- 35811 Weideman St
- 36047 Weideman St
- 21600 Elmway St
- 36335 Weideman St
- 36426 Weideman St
- 21903 Elmway St
- 35906 Rewa St
- 22211 Grandy St
- 22252 Dale Allen St
- 22311 Spitzley St
- 20830 Lantz St
- 22021 15 Mile Rd
- 35408 Willis St
- 21911 Sharkey St
- 22011 Sharkey St
- 21934 S Nunneley Rd
- 22317 E Schafer St
- 22459 Katzman St
- 35903 Little MacK Ave
- 21661 Hillside Dr Unit B2
- 21661 Hillside Dr Unit C2
- 21661 Hillside Dr Unit A2
- 21661 Hillside Dr Unit B1
- 21661 Hillside Dr Unit D1
- 21661 Hillside Dr Unit C1
- 21661 Hillside Dr Unit A1
- 21661 Hillside Dr Unit B3
- 21661 Hillside Dr Unit D3
- 21661 Hillside Dr Unit C3
- 21661 Hillside Dr Unit A3
- 21681 Hillside Dr Unit A2
- 21681 Hillside Dr Unit C2
- 21681 Hillside Dr Unit D2
- 21681 Hillside Dr Unit B2
- 21681 Hillside Dr Unit A1
- 21681 Hillside Dr Unit C1
- 21681 Hillside Dr Unit D1
- 21681 Hillside Dr Unit B1
- 21681 Hillside Dr Unit D3