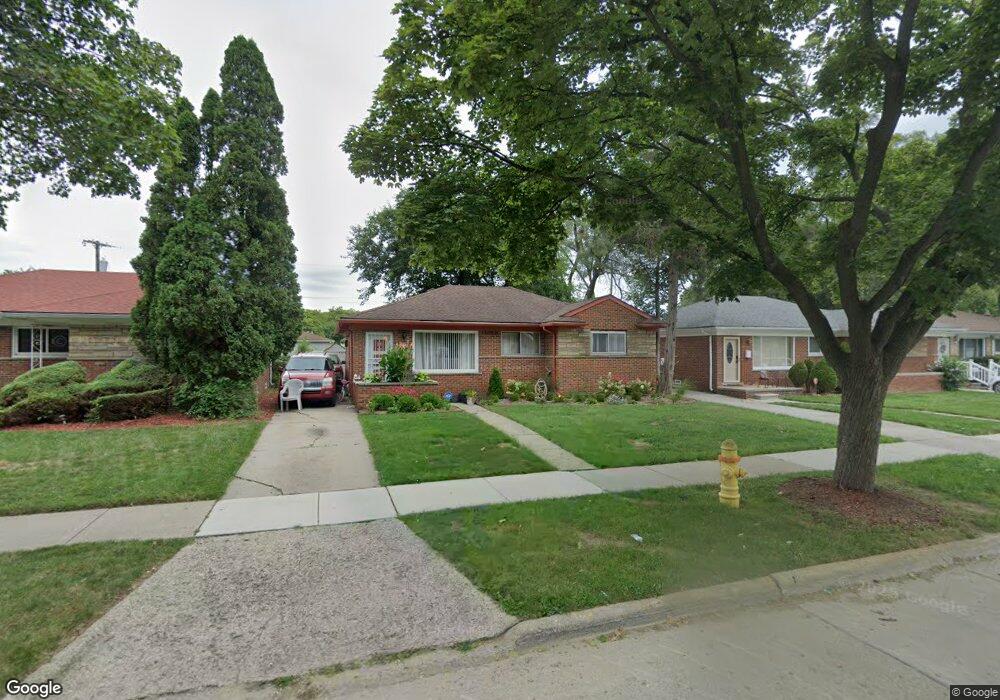
21661 Westhampton St Oak Park, MI 48237
Estimated Value: $221,020 - $248,000
3
Beds
2
Baths
1,306
Sq Ft
$181/Sq Ft
Est. Value
About This Home
This home is located at 21661 Westhampton St, Oak Park, MI 48237 and is currently estimated at $236,755, approximately $181 per square foot. 21661 Westhampton St is a home located in Oakland County with nearby schools including Einstein Elementary School, Oak Park Service Learning Academy, and Oak Park Service Learning Academy Opsla.
Ownership History
Date
Name
Owned For
Owner Type
Purchase Details
Closed on
Jan 12, 2011
Sold by
Knight Niki
Bought by
Williams Paul A
Current Estimated Value
Home Financials for this Owner
Home Financials are based on the most recent Mortgage that was taken out on this home.
Original Mortgage
$34,458
Outstanding Balance
$23,537
Interest Rate
4.82%
Mortgage Type
FHA
Estimated Equity
$213,218
Purchase Details
Closed on
Jan 4, 2006
Sold by
Countrywide Home Loans Inc
Bought by
Knight Niki
Home Financials for this Owner
Home Financials are based on the most recent Mortgage that was taken out on this home.
Original Mortgage
$89,250
Interest Rate
10.7%
Mortgage Type
Adjustable Rate Mortgage/ARM
Purchase Details
Closed on
Oct 13, 2005
Sold by
Mortgage Electronic Registration Systems
Bought by
Countrywide Home Loans Inc
Purchase Details
Closed on
Mar 15, 2005
Sold by
Hunter Evelyn S
Bought by
Mortgage Electronic Registration Systems
Create a Home Valuation Report for This Property
The Home Valuation Report is an in-depth analysis detailing your home's value as well as a comparison with similar homes in the area
Home Values in the Area
Average Home Value in this Area
Purchase History
| Date | Buyer | Sale Price | Title Company |
|---|---|---|---|
| Williams Paul A | $35,000 | Greater Macomb Title Agency | |
| Knight Niki | $105,000 | None Available | |
| Countrywide Home Loans Inc | -- | None Available | |
| Mortgage Electronic Registration Systems | $126,810 | -- |
Source: Public Records
Mortgage History
| Date | Status | Borrower | Loan Amount |
|---|---|---|---|
| Open | Williams Paul A | $34,458 | |
| Previous Owner | Knight Niki | $89,250 |
Source: Public Records
Tax History Compared to Growth
Tax History
| Year | Tax Paid | Tax Assessment Tax Assessment Total Assessment is a certain percentage of the fair market value that is determined by local assessors to be the total taxable value of land and additions on the property. | Land | Improvement |
|---|---|---|---|---|
| 2024 | $2,431 | $100,800 | $15,500 | $85,300 |
| 2023 | $2,327 | $88,600 | $13,700 | $74,900 |
| 2022 | $2,234 | $75,100 | $12,100 | $63,000 |
| 2021 | $2,211 | $70,200 | $6,200 | $64,000 |
| 2020 | $2,152 | $58,200 | $6,200 | $52,000 |
| 2018 | $2,139 | $37,100 | $0 | $0 |
| 2015 | -- | $29,300 | $0 | $0 |
| 2014 | -- | $25,500 | $0 | $0 |
| 2011 | -- | $34,700 | $0 | $0 |
Source: Public Records
Map
Nearby Homes
- 13941 Pearson St
- 21710 Parklawn St
- 21630 Westhampton St
- 21661 Cloverlawn St
- 21460 Parklawn St
- 21430 Ridgedale St
- 21310 Gardner St
- 14211 Northend Ave
- 13341 Albany St
- 22000 Blackstone St
- 22130 Gardner St
- 22191 Ridgedale St
- 22030 Dante St
- 22020 Sussex St
- 14220 Greenbriar St
- 14610 Pearson St
- 22100 Dante St
- 22100 Dante St Unit bldg F unit 114
- 22051 Fern St
- 21961 Whitmore St
- 21701 Westhampton St
- 21651 Westhampton St
- 21711 Westhampton St
- 21641 Westhampton St
- 21660 Kipling St
- 21650 Kipling St
- 21700 Kipling St
- 21721 Westhampton St Unit Bldg-Unit
- 21721 Westhampton St
- 21631 Westhampton St Unit Bldg-Unit
- 21631 Westhampton St
- 21640 Kipling St
- 21710 Kipling St
- 21660 Westhampton St
- 21630 Kipling St
- 21621 Westhampton St
- 21731 Westhampton St
- 21650 Westhampton St
- 21700 Westhampton St
- 21640 Westhampton St