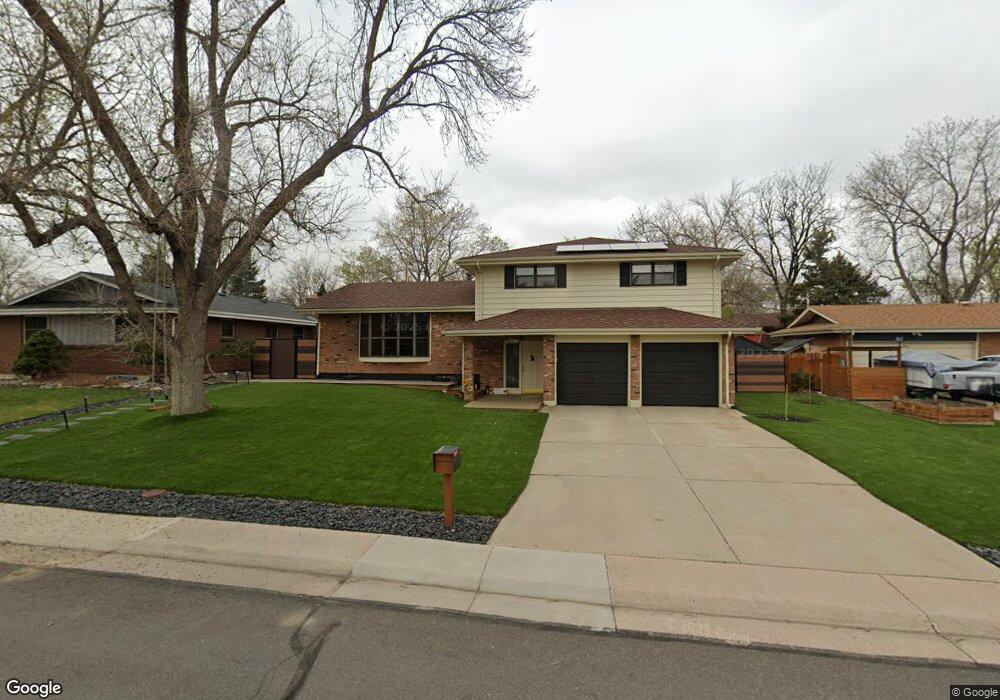
2167 S Balsam Ct Lakewood, CO 80227
Carmody NeighborhoodEstimated Value: $658,000 - $734,000
4
Beds
3
Baths
2,664
Sq Ft
$258/Sq Ft
Est. Value
About This Home
This home is located at 2167 S Balsam Ct, Lakewood, CO 80227 and is currently estimated at $686,628, approximately $257 per square foot. 2167 S Balsam Ct is a home located in Jefferson County with nearby schools including Green Gables Elementary School, Carmody Middle School, and Bear Creek High School.
Ownership History
Date
Name
Owned For
Owner Type
Purchase Details
Closed on
Dec 21, 2016
Sold by
Malone Rex Alan
Bought by
Garza Simona P and Moore Lenora L
Current Estimated Value
Home Financials for this Owner
Home Financials are based on the most recent Mortgage that was taken out on this home.
Original Mortgage
$337,000
Outstanding Balance
$162,512
Interest Rate
3.57%
Mortgage Type
New Conventional
Estimated Equity
$524,116
Purchase Details
Closed on
Sep 29, 2005
Sold by
Smith David R and Smith Carolyn O
Bought by
Malone Rex Alan
Home Financials for this Owner
Home Financials are based on the most recent Mortgage that was taken out on this home.
Original Mortgage
$214,800
Interest Rate
5.73%
Mortgage Type
Fannie Mae Freddie Mac
Purchase Details
Closed on
Nov 23, 1999
Sold by
Padden Fred Trust Padden Isabelle Trust
Bought by
Smith David R and Smith Carolyn O
Home Financials for this Owner
Home Financials are based on the most recent Mortgage that was taken out on this home.
Original Mortgage
$110,000
Interest Rate
7.93%
Create a Home Valuation Report for This Property
The Home Valuation Report is an in-depth analysis detailing your home's value as well as a comparison with similar homes in the area
Home Values in the Area
Average Home Value in this Area
Purchase History
| Date | Buyer | Sale Price | Title Company |
|---|---|---|---|
| Garza Simona P | $393,000 | Land Title Guarantee Co | |
| Malone Rex Alan | $268,500 | Title America | |
| Smith David R | $210,000 | -- |
Source: Public Records
Mortgage History
| Date | Status | Borrower | Loan Amount |
|---|---|---|---|
| Open | Garza Simona P | $337,000 | |
| Previous Owner | Malone Rex Alan | $214,800 | |
| Previous Owner | Smith David R | $110,000 | |
| Closed | Smith David R | $30,000 |
Source: Public Records
Tax History Compared to Growth
Tax History
| Year | Tax Paid | Tax Assessment Tax Assessment Total Assessment is a certain percentage of the fair market value that is determined by local assessors to be the total taxable value of land and additions on the property. | Land | Improvement |
|---|---|---|---|---|
| 2024 | $3,510 | $38,469 | $14,287 | $24,182 |
| 2023 | $3,510 | $38,469 | $14,287 | $24,182 |
| 2022 | $2,888 | $30,893 | $11,007 | $19,886 |
| 2021 | $2,929 | $31,783 | $11,324 | $20,459 |
| 2020 | $2,626 | $28,590 | $9,486 | $19,104 |
| 2019 | $2,593 | $28,590 | $9,486 | $19,104 |
| 2018 | $2,574 | $27,421 | $7,484 | $19,937 |
| 2017 | $2,267 | $27,421 | $7,484 | $19,937 |
| 2016 | $2,155 | $24,303 | $6,098 | $18,205 |
| 2015 | $2,176 | $24,303 | $6,098 | $18,205 |
| 2014 | $1,882 | $19,453 | $5,300 | $14,153 |
Source: Public Records
Map
Nearby Homes
- 8346 W Woodard Dr
- 8321 W Evans Ave
- 2146 S Yarrow St
- 2021 S Balsam St
- 2125 S Wadsworth Blvd
- 2460 S Ammons St
- 1868 S Ammons St Unit A
- 8696 W Iliff Ave
- 8616 W Utah Ave
- 7488 W Pacific Ln
- 7446 W Evans Place
- 2173 S Field St
- 2538 S Dover Way
- 8870 W Jewell Ave Unit 3
- 1766 S Cape St
- 1720 S Ammons St Unit A
- 9000 W Jewell Ave
- 7203 W Pacific Ave
- 1632 S Cody St
- 8854 W La Salle Ave
- 2157 S Balsam Ct
- 2177 S Balsam Ct
- 2172 S Brentwood St
- 2162 S Brentwood St
- 2156 S Balsam Ct
- 2147 S Balsam Ct
- 2187 S Balsam Ct
- 2166 S Balsam Ct
- 2146 S Balsam Ct
- 2142 S Brentwood St
- 2182 S Brentwood St
- 2176 S Balsam Ct
- 2137 S Balsam Ct
- 2197 S Balsam Ct
- 2155 S Ammons St
- 2145 S Ammons St
- 2183 S Brentwood St
- 2163 S Brentwood St
- 2126 S Balsam Ct
- 2196 S Balsam Ct