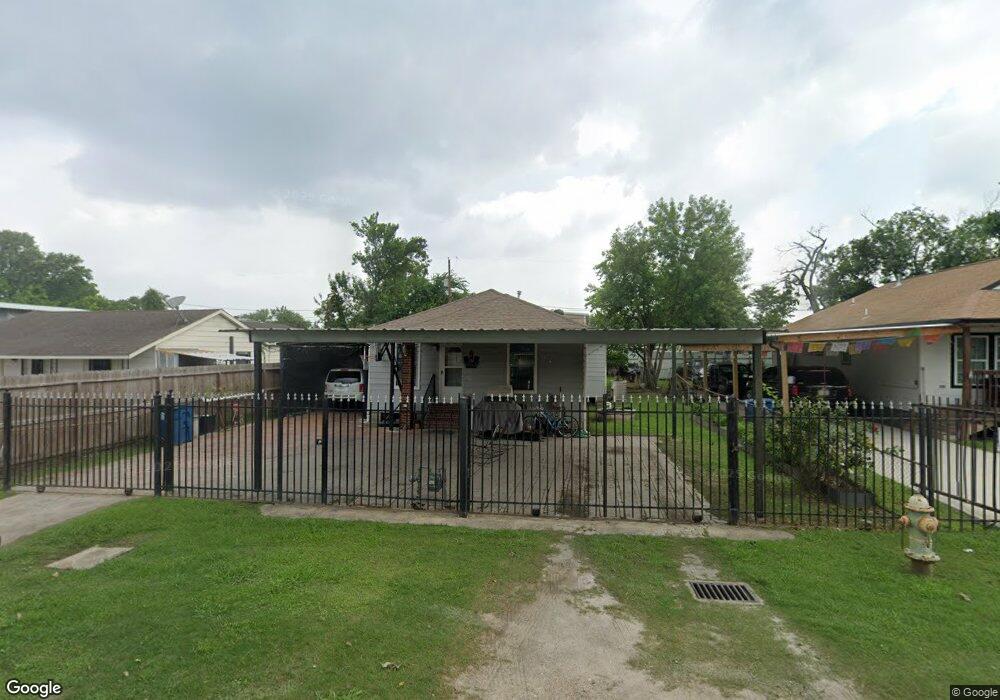
2167 Warwick Rd Houston, TX 77093
East Aldine NeighborhoodEstimated Value: $184,000 - $241,000
3
Beds
2
Baths
1,370
Sq Ft
$147/Sq Ft
Est. Value
About This Home
This home is located at 2167 Warwick Rd, Houston, TX 77093 and is currently estimated at $201,161, approximately $146 per square foot. 2167 Warwick Rd is a home located in Harris County with nearby schools including Scarborough Elementary School, Patrick Henry Middle School, and Sam Houston Math, Science & Technology Center.
Ownership History
Date
Name
Owned For
Owner Type
Purchase Details
Closed on
Apr 27, 2005
Sold by
Molina Naomi
Bought by
Franco Hipolito
Current Estimated Value
Home Financials for this Owner
Home Financials are based on the most recent Mortgage that was taken out on this home.
Original Mortgage
$9,400
Outstanding Balance
$4,810
Interest Rate
5.55%
Mortgage Type
Seller Take Back
Estimated Equity
$196,351
Purchase Details
Closed on
Apr 17, 1996
Sold by
Ryter Billie M
Bought by
Franco Hipolito Garcia and Franco Naomie Molina
Purchase Details
Closed on
Apr 6, 1995
Sold by
Shears Patsy Elizabeth
Bought by
Garcia Isaias Franco
Home Financials for this Owner
Home Financials are based on the most recent Mortgage that was taken out on this home.
Original Mortgage
$6,000
Interest Rate
8%
Mortgage Type
Seller Take Back
Purchase Details
Closed on
Jul 13, 1994
Sold by
Demers Irene M
Bought by
Ryter Billie M
Create a Home Valuation Report for This Property
The Home Valuation Report is an in-depth analysis detailing your home's value as well as a comparison with similar homes in the area
Home Values in the Area
Average Home Value in this Area
Purchase History
| Date | Buyer | Sale Price | Title Company |
|---|---|---|---|
| Franco Hipolito | -- | -- | |
| Franco Hipolito Garcia | -- | -- | |
| Garcia Isaias Franco | -- | -- | |
| Ryter Billie M | -- | -- |
Source: Public Records
Mortgage History
| Date | Status | Borrower | Loan Amount |
|---|---|---|---|
| Open | Franco Hipolito | $9,400 | |
| Previous Owner | Garcia Isaias Franco | $6,000 |
Source: Public Records
Tax History
| Year | Tax Paid | Tax Assessment Tax Assessment Total Assessment is a certain percentage of the fair market value that is determined by local assessors to be the total taxable value of land and additions on the property. | Land | Improvement |
|---|---|---|---|---|
| 2025 | $816 | $152,778 | $63,090 | $89,688 |
| 2024 | $816 | $152,778 | $63,090 | $89,688 |
| 2023 | $816 | $152,884 | $63,090 | $89,794 |
| 2022 | $1,669 | $119,424 | $43,813 | $75,611 |
| 2021 | $1,611 | $103,720 | $43,813 | $59,907 |
| 2020 | $1,523 | $90,089 | $33,999 | $56,090 |
| 2019 | $1,445 | $102,995 | $33,999 | $68,996 |
| 2018 | $780 | $61,303 | $30,844 | $30,459 |
| 2017 | $1,313 | $61,303 | $30,844 | $30,459 |
| 2016 | $1,313 | $61,303 | $30,844 | $30,459 |
| 2015 | $902 | $68,701 | $19,278 | $49,423 |
| 2014 | $902 | $68,701 | $19,278 | $49,423 |
Source: Public Records
Map
Nearby Homes
- 2237 Cromwell St
- 2311 Warwick Rd
- 2131 Warwick Rd
- 2123 Warwick Rd
- 1939 Hopper Rd
- 2423 Chamberlain St
- 11216 Rusty St
- 2522 Kowis St
- 1925 Sunny Dr
- 0 Kowis
- 1805 Chamberlain St
- 2530 Kowis St
- 2414 Lone Oak Rd
- 2430 Lone Oak Rd Unit 1
- 2502 Lone Oak Rd
- 2506 Lone Oak Rd
- 2523 Lone Oak Rd
- 2512 Lone Oak Rd
- 2527 Lone Oak Rd
- 2629 Kowis St
- 2201 Warwick Rd
- 2163 Warwick Rd
- 2163 Warwick Rd
- 2168 Hopper Rd
- 2205 Warwick Rd
- 2164 Hopper Rd
- 2200 Hopper Rd
- 2162 Hopper Rd
- 2172 Warwick Rd
- 2168 Warwick Rd
- 2202 Warwick Rd
- 2210 Hopper Rd
- 2206 Warwick Rd
- 2210 Warwick Rd
- 2214 Hopper Rd
- 2156 Hopper Rd
- 2156 Hopper Rd Unit A
- 2156 Hopper Rd Unit B
- 2217 Warwick Rd
- 2147 Warwick Rd
Your Personal Tour Guide
Ask me questions while you tour the home.