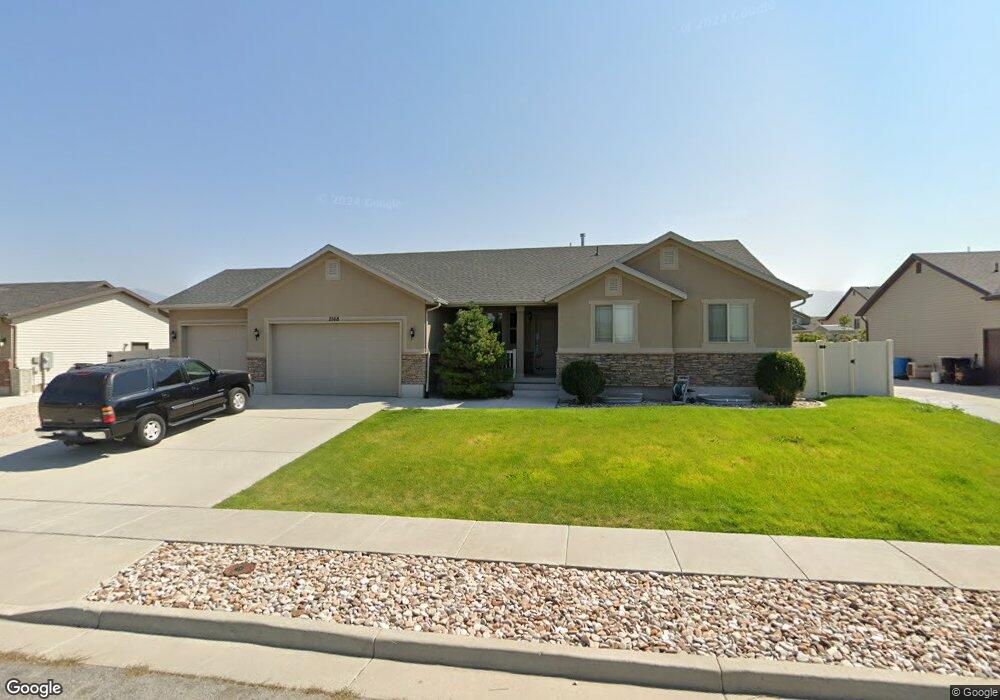
2168 N 170 W Tooele, UT 84074
Estimated Value: $543,933 - $563,000
4
Beds
2
Baths
3,323
Sq Ft
$166/Sq Ft
Est. Value
About This Home
This home is located at 2168 N 170 W, Tooele, UT 84074 and is currently estimated at $553,233, approximately $166 per square foot. 2168 N 170 W is a home located in Tooele County with nearby schools including Overlake Elementary School, Clarke N. Johnsen Junior High School, and Stansbury High School.
Ownership History
Date
Name
Owned For
Owner Type
Purchase Details
Closed on
Jun 14, 2010
Sold by
Corporation Of The Presiding Bishop Of T
Bought by
Perez Dominic and Perez Joleerr
Current Estimated Value
Home Financials for this Owner
Home Financials are based on the most recent Mortgage that was taken out on this home.
Original Mortgage
$193,000
Outstanding Balance
$128,713
Interest Rate
4.87%
Mortgage Type
FHA
Estimated Equity
$424,520
Purchase Details
Closed on
Jun 4, 2010
Sold by
Bird Scott C and Bird Shelle L
Bought by
Corporation Of The Presiding Bishop Of T
Home Financials for this Owner
Home Financials are based on the most recent Mortgage that was taken out on this home.
Original Mortgage
$193,000
Outstanding Balance
$128,713
Interest Rate
4.87%
Mortgage Type
FHA
Estimated Equity
$424,520
Purchase Details
Closed on
Nov 2, 2008
Sold by
Hallmark Homes And Development
Bought by
Bird Scott C and Bird Shelle L
Home Financials for this Owner
Home Financials are based on the most recent Mortgage that was taken out on this home.
Original Mortgage
$194,360
Interest Rate
6.07%
Mortgage Type
New Conventional
Create a Home Valuation Report for This Property
The Home Valuation Report is an in-depth analysis detailing your home's value as well as a comparison with similar homes in the area
Purchase History
| Date | Buyer | Sale Price | Title Company |
|---|---|---|---|
| Perez Dominic | -- | B & E Title | |
| Corporation Of The Presiding Bishop Of T | -- | B&D Title | |
| Bird Scott C | -- | Merill Title Co |
Source: Public Records
Mortgage History
| Date | Status | Borrower | Loan Amount |
|---|---|---|---|
| Open | Perez Dominic | $193,000 | |
| Previous Owner | Bird Scott C | $194,360 |
Source: Public Records
Tax History
| Year | Tax Paid | Tax Assessment Tax Assessment Total Assessment is a certain percentage of the fair market value that is determined by local assessors to be the total taxable value of land and additions on the property. | Land | Improvement |
|---|---|---|---|---|
| 2025 | $3,743 | $548,508 | $110,000 | $438,508 |
| 2024 | $4,086 | $302,118 | $60,500 | $241,618 |
| 2023 | $4,086 | $299,101 | $57,608 | $241,493 |
| 2022 | $3,214 | $265,614 | $70,290 | $195,324 |
| 2021 | $2,990 | $205,432 | $23,238 | $182,194 |
| 2020 | $3,109 | $376,174 | $42,250 | $333,924 |
| 2019 | $3,008 | $360,273 | $42,250 | $318,023 |
| 2018 | $2,716 | $309,511 | $40,000 | $269,511 |
| 2017 | $2,165 | $291,879 | $40,000 | $251,879 |
| 2016 | $1,678 | $125,001 | $16,500 | $108,501 |
| 2015 | $1,678 | $118,990 | $0 | $0 |
| 2014 | -- | $118,990 | $0 | $0 |
Source: Public Records
Map
Nearby Homes
- 2184 N 170 W
- 2124 N 90 W
- 2129 N Berra Blvd
- 2297 N 250 W
- 2042 N Essie Dr
- 81 W 1930 N
- 2098 N 425 W
- 1909 N 70 W
- 377 W 2030 N
- 2157 N 425 W
- 1893 N 70 W
- 2067 N 450 W Unit 206
- 2067 N 450 W
- 88 Aparicio Dr
- 533 W South Temple St Unit 309
- 522 W 1910 N Unit 309
- 2467 N Deseret View St
- 1648 Dawson Ln
- 1742 N 80 E
- 513 Dimaggio Dr Unit 434
Your Personal Tour Guide
Ask me questions while you tour the home.