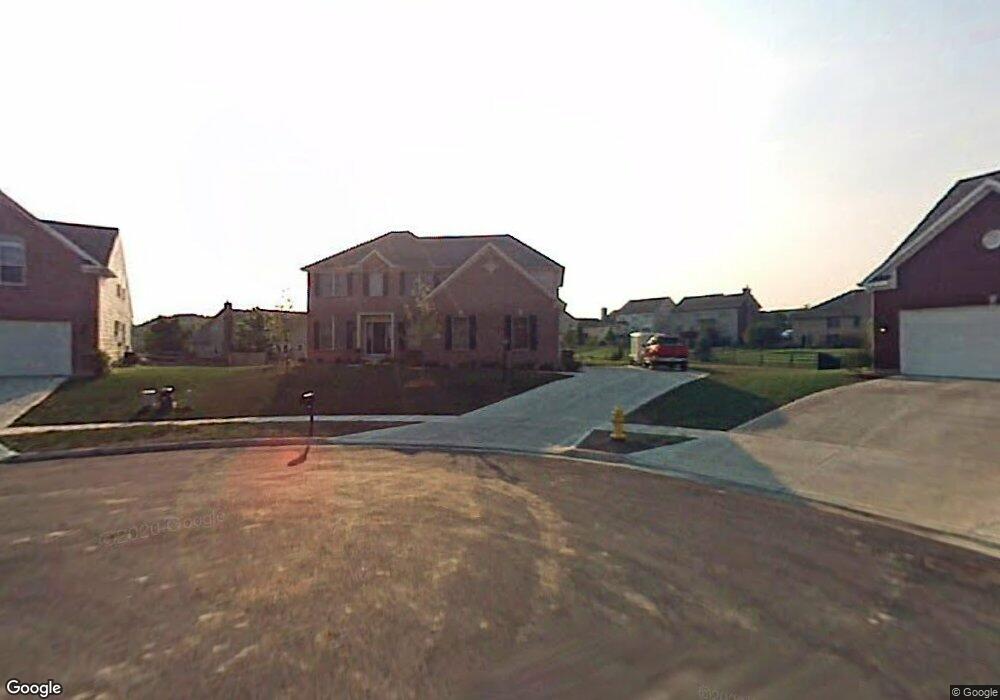
2169 Marchfield Way Beavercreek, OH 45434
Estimated Value: $523,000 - $584,000
4
Beds
4
Baths
3,168
Sq Ft
$173/Sq Ft
Est. Value
About This Home
This home is located at 2169 Marchfield Way, Beavercreek, OH 45434 and is currently estimated at $547,479, approximately $172 per square foot. 2169 Marchfield Way is a home located in Greene County with nearby schools including Trebein Elementary School, Jacob Coy Middle School, and Beavercreek High School.
Ownership History
Date
Name
Owned For
Owner Type
Purchase Details
Closed on
Jul 2, 2013
Sold by
Moddeman Mark and Moddeman Tanga D
Bought by
Incenta Federal Credit Union
Current Estimated Value
Purchase Details
Closed on
Apr 12, 2006
Sold by
Coventry Fine Homes Inc
Bought by
Moddeman Mark
Home Financials for this Owner
Home Financials are based on the most recent Mortgage that was taken out on this home.
Original Mortgage
$248,400
Interest Rate
6.34%
Mortgage Type
Fannie Mae Freddie Mac
Purchase Details
Closed on
Oct 7, 2005
Sold by
Ajv Development Llc
Bought by
Coventry Fine Homes Inc
Home Financials for this Owner
Home Financials are based on the most recent Mortgage that was taken out on this home.
Original Mortgage
$236,700
Interest Rate
5.83%
Mortgage Type
Construction
Create a Home Valuation Report for This Property
The Home Valuation Report is an in-depth analysis detailing your home's value as well as a comparison with similar homes in the area
Home Values in the Area
Average Home Value in this Area
Purchase History
| Date | Buyer | Sale Price | Title Company |
|---|---|---|---|
| Incenta Federal Credit Union | $18,789 | None Available | |
| Moddeman Mark | $310,600 | None Available | |
| Coventry Fine Homes Inc | $59,000 | -- |
Source: Public Records
Mortgage History
| Date | Status | Borrower | Loan Amount |
|---|---|---|---|
| Previous Owner | Moddeman Mark | $248,400 | |
| Previous Owner | Coventry Fine Homes Inc | $236,700 |
Source: Public Records
Tax History Compared to Growth
Tax History
| Year | Tax Paid | Tax Assessment Tax Assessment Total Assessment is a certain percentage of the fair market value that is determined by local assessors to be the total taxable value of land and additions on the property. | Land | Improvement |
|---|---|---|---|---|
| 2024 | $9,737 | $146,240 | $29,810 | $116,430 |
| 2023 | $9,737 | $146,240 | $29,810 | $116,430 |
| 2022 | $8,777 | $116,360 | $22,930 | $93,430 |
| 2021 | $8,604 | $116,360 | $22,930 | $93,430 |
| 2020 | $8,669 | $116,360 | $22,930 | $93,430 |
| 2019 | $8,919 | $109,300 | $22,860 | $86,440 |
| 2018 | $7,894 | $109,300 | $22,860 | $86,440 |
| 2017 | $7,763 | $109,300 | $22,860 | $86,440 |
| 2016 | $8,124 | $108,940 | $22,860 | $86,080 |
| 2015 | $8,078 | $108,940 | $22,860 | $86,080 |
| 2014 | $7,960 | $108,940 | $22,860 | $86,080 |
Source: Public Records
Map
Nearby Homes
- 1238 Freedom Point
- 2245 Tourney Trail
- 2073 Lincolnshire Dr
- 1535 Stretch Dr
- 1360 Backridge Ct
- 1361 Obetz Dr Unit A
- 1394 Crown Point Ct
- 2331 Eastwind Dr
- 1210 Lomeda Ln
- 895 Alpha Rd
- 2154 Sulky Trail
- 2162 Sulky Trail
- 1051 Forest Dr
- 887 Shady Ln
- 2507 Obetz Dr
- 2162 Owen E
- 2418 Owen W
- 2570 Mardella Dr
- 1156 Westover Rd
- 1359 Fudge Dr
- 2161 Marchfield Way
- 2168 Hunters Ridge Blvd
- 2170 Marchfield Way
- 2185 Wedgewood Dr
- 2191 Wedgewood Dr
- 2172 Hunters Ridge Blvd
- 2179 Wedgewood Dr
- 2155 Marchfield Way
- 2171 Hunters Ridge Blvd
- 2162 Marchfield Way
- 2195 Wedgewood Dr
- 2171 Wedgewood Dr
- 2154 Marchfield Way
- 2161 Wedgewood Dr
- 2199 Wedgewood Dr
- 2149 Marchfield Way
- 2184 Hunters Ridge Blvd
- 2177 Hunters Ridge Blvd
- 2146 Marchfield Way
- 2141 Wedgewood Dr