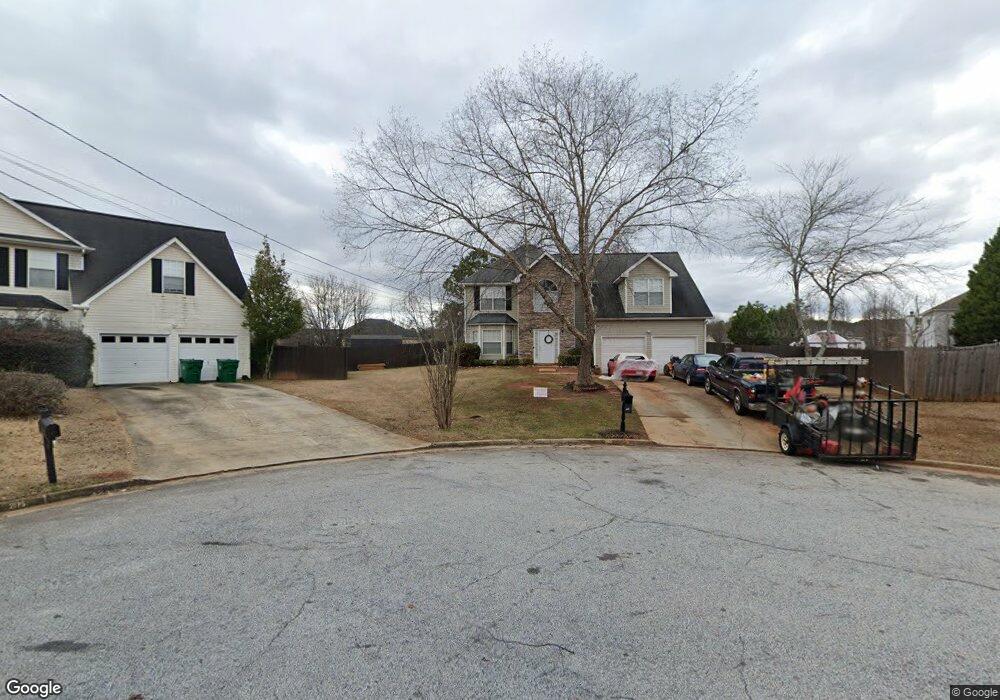
2169 Trickle Creek Ct Unit 176 Decatur, GA 30035
Southwest DeKalb NeighborhoodEstimated Value: $312,000 - $386,000
4
Beds
3
Baths
2,730
Sq Ft
$123/Sq Ft
Est. Value
About This Home
This home is located at 2169 Trickle Creek Ct Unit 176, Decatur, GA 30035 and is currently estimated at $335,876, approximately $123 per square foot. 2169 Trickle Creek Ct Unit 176 is a home located in DeKalb County with nearby schools including Canby Lane Elementary School, Mary McLeod Bethune Middle School, and Towers High School.
Ownership History
Date
Name
Owned For
Owner Type
Purchase Details
Closed on
Dec 17, 2019
Sold by
Silavong Johnny
Bought by
Phillips Queena
Current Estimated Value
Home Financials for this Owner
Home Financials are based on the most recent Mortgage that was taken out on this home.
Original Mortgage
$175,757
Outstanding Balance
$154,955
Interest Rate
3.6%
Mortgage Type
FHA
Estimated Equity
$180,921
Purchase Details
Closed on
Feb 27, 2006
Sold by
Hammonds Derrick and Hammonds Tammy W
Bought by
Silavong Johnny and Chanthathirath Sourivanh
Home Financials for this Owner
Home Financials are based on the most recent Mortgage that was taken out on this home.
Original Mortgage
$179,900
Interest Rate
6.04%
Mortgage Type
New Conventional
Purchase Details
Closed on
Aug 14, 1998
Sold by
Wellington Creek Dev Co Inc
Bought by
Hammonds Derrick and Hammonds Tammy W
Home Financials for this Owner
Home Financials are based on the most recent Mortgage that was taken out on this home.
Original Mortgage
$125,950
Interest Rate
6.91%
Mortgage Type
FHA
Create a Home Valuation Report for This Property
The Home Valuation Report is an in-depth analysis detailing your home's value as well as a comparison with similar homes in the area
Home Values in the Area
Average Home Value in this Area
Purchase History
| Date | Buyer | Sale Price | Title Company |
|---|---|---|---|
| Phillips Queena | $179,000 | -- | |
| Phillips Queena | $179,000 | -- | |
| Silavong Johnny | $179,900 | -- | |
| Silavong Johnny | $179,900 | -- | |
| Hammonds Derrick | $129,400 | -- | |
| Hammonds Derrick | $129,400 | -- |
Source: Public Records
Mortgage History
| Date | Status | Borrower | Loan Amount |
|---|---|---|---|
| Open | Phillips Queena | $175,757 | |
| Previous Owner | Silavong Johnny | $179,900 | |
| Previous Owner | Hammonds Derrick | $125,950 |
Source: Public Records
Tax History Compared to Growth
Tax History
| Year | Tax Paid | Tax Assessment Tax Assessment Total Assessment is a certain percentage of the fair market value that is determined by local assessors to be the total taxable value of land and additions on the property. | Land | Improvement |
|---|---|---|---|---|
| 2025 | $3,608 | $125,680 | $16,000 | $109,680 |
| 2024 | $3,744 | $127,120 | $16,000 | $111,120 |
| 2023 | $3,744 | $127,320 | $12,000 | $115,320 |
| 2022 | $3,390 | $114,080 | $7,720 | $106,360 |
| 2021 | $2,698 | $84,080 | $7,720 | $76,360 |
| 2020 | $2,409 | $71,600 | $7,280 | $64,320 |
| 2019 | $3,501 | $72,120 | $7,720 | $64,400 |
| 2018 | $2,821 | $67,560 | $7,720 | $59,840 |
| 2017 | $3,032 | $61,160 | $7,720 | $53,440 |
| 2016 | $2,902 | $58,080 | $7,720 | $50,360 |
| 2014 | $2,655 | $51,200 | $7,720 | $43,480 |
Source: Public Records
Map
Nearby Homes
- 4827 Snap Creek Ln
- 2065 Resting Creek Dr
- 2109 Creekview Trail
- 4783 Creekside Place
- 2183 Ramblewood Cir
- 4817 Hidden Creek Place Unit 2B
- 4839 Plymouth Trace Unit 2
- 2180 Hidden Creek Dr
- 4579 Tudor Castle Dr
- 2428 Marsh Rabbit Bend
- 2329 Wilkins Cove
- 2317 Wilkins Ct
- Pearson Plan at Young's Crossing
- 4890 Wilkins Station Dr
- 2322 Wilkins Ct
- 5655 Covington Hwy
- 2332 Wilkins Ct Unit 1
- 2078 Moss Hill Rd
- 2080 Moss Hill Rd
- 2064 Crossing Rd
- 2169 Trickle Creek Ct
- 2159 Trickle Creek Ct
- 2175 Trickle Creek Ct Unit 1
- 2395 Waters Run Unit 1
- 2389 Waters Run Unit 1
- 2379 Waters Run Unit I
- 2176 Trickle Creek Ct
- 2401 Waters Run
- 2367 Waters Run
- 2367 Waters Run Unit 1
- 2160 Trickle Creek Ct
- 2170 Trickle Creek Ct
- 2135 Waters Run
- 37546 Waters Run
- 2407 Waters Run
- 2261 Swift Current Dr
- 2400 Waters Run
- 2357 Waters Run
- 2144 Waters Run Unit 1
- 2251 Swift Current Dr