Estimated Value: $122,000 - $138,000
3
Beds
2
Baths
1,150
Sq Ft
$114/Sq Ft
Est. Value
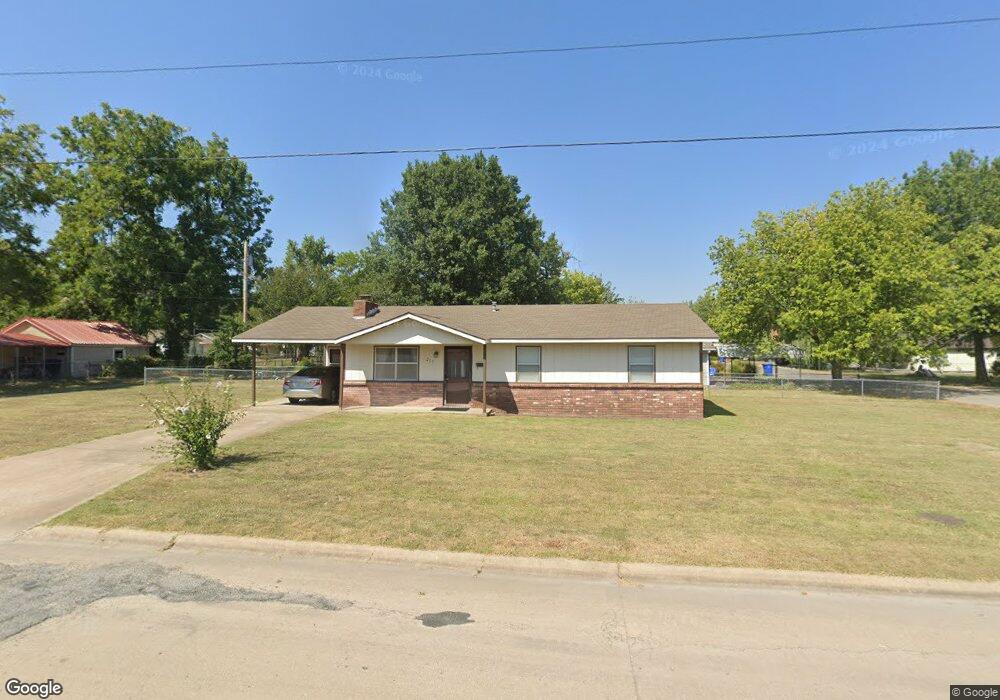
About This Home
This home is located at 217 18th Ave NE, Miami, OK 74354 and is currently estimated at $130,533, approximately $113 per square foot. 217 18th Ave NE is a home located in Ottawa County with nearby schools including Miami High School and Mt. Olive Lutheran School.
Ownership History
Date
Name
Owned For
Owner Type
Purchase Details
Closed on
Oct 31, 2019
Sold by
Vicky Fleming Management Inc
Bought by
Santamaria Maria G
Current Estimated Value
Home Financials for this Owner
Home Financials are based on the most recent Mortgage that was taken out on this home.
Original Mortgage
$82,828
Outstanding Balance
$72,856
Interest Rate
3.7%
Mortgage Type
New Conventional
Estimated Equity
$57,677
Purchase Details
Closed on
Aug 12, 2019
Sold by
Volkenburg Carl W Van and Volkenburg Leah M Van
Bought by
Vicky Fleming Management Inc
Create a Home Valuation Report for This Property
The Home Valuation Report is an in-depth analysis detailing your home's value as well as a comparison with similar homes in the area
Home Values in the Area
Average Home Value in this Area
Purchase History
| Date | Buyer | Sale Price | Title Company |
|---|---|---|---|
| Santamaria Maria G | $82,000 | Apex Title & Closing Service | |
| Vicky Fleming Management Inc | $35,000 | Apex Ttl & Closing Svcs Llc |
Source: Public Records
Mortgage History
| Date | Status | Borrower | Loan Amount |
|---|---|---|---|
| Open | Santamaria Maria G | $82,828 |
Source: Public Records
Tax History Compared to Growth
Tax History
| Year | Tax Paid | Tax Assessment Tax Assessment Total Assessment is a certain percentage of the fair market value that is determined by local assessors to be the total taxable value of land and additions on the property. | Land | Improvement |
|---|---|---|---|---|
| 2025 | $1,095 | $11,931 | $430 | $11,501 |
| 2024 | $1,095 | $11,363 | $430 | $10,933 |
| 2023 | $1,095 | $10,822 | $430 | $10,392 |
| 2022 | $953 | $10,307 | $430 | $9,877 |
| 2021 | $928 | $9,816 | $430 | $9,386 |
| 2020 | $891 | $9,349 | $431 | $8,918 |
| 2019 | $482 | $5,869 | $430 | $5,439 |
| 2018 | $485 | $5,870 | $798 | $5,072 |
| 2017 | $470 | $5,590 | $716 | $4,874 |
| 2016 | $428 | $5,325 | $639 | $4,686 |
| 2015 | $397 | $4,471 | $599 | $3,872 |
| 2014 | $415 | $5,071 | $599 | $4,472 |
Source: Public Records
Map
Nearby Homes