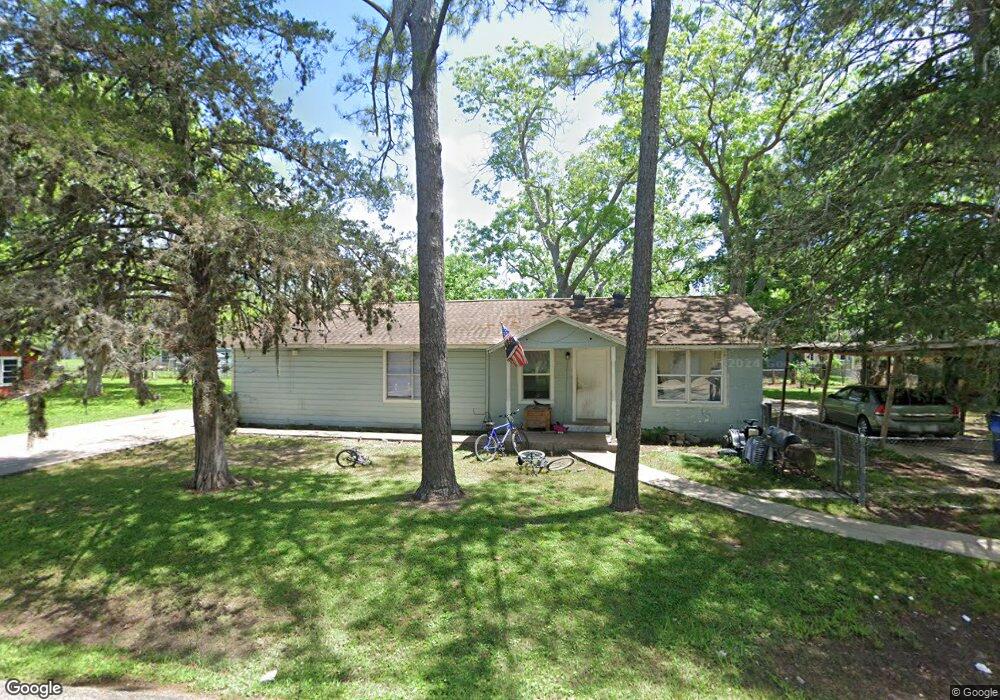
217 4th St Brazoria, TX 77422
Estimated Value: $173,000 - $216,000
3
Beds
1
Bath
1,372
Sq Ft
$137/Sq Ft
Est. Value
About This Home
This home is located at 217 4th St, Brazoria, TX 77422 and is currently estimated at $188,242, approximately $137 per square foot. 217 4th St is a home located in Brazoria County.
Ownership History
Date
Name
Owned For
Owner Type
Purchase Details
Closed on
Mar 13, 2014
Sold by
Prosperity Bank
Bought by
Angel & Noor Co
Current Estimated Value
Purchase Details
Closed on
Sep 10, 2013
Sold by
Gros Randall H and Gros Toni G
Bought by
Prosperity Bank
Home Financials for this Owner
Home Financials are based on the most recent Mortgage that was taken out on this home.
Original Mortgage
$26,000
Interest Rate
4.41%
Mortgage Type
Purchase Money Mortgage
Purchase Details
Closed on
Jul 16, 2009
Sold by
Dickens Rev Bobby and Dickens Myrlene
Bought by
Caros Randall H and Caros Toni C
Purchase Details
Closed on
Jan 5, 2009
Sold by
Dickens Bob
Bought by
Gros Randall H and Gros Toni C
Create a Home Valuation Report for This Property
The Home Valuation Report is an in-depth analysis detailing your home's value as well as a comparison with similar homes in the area
Purchase History
| Date | Buyer | Sale Price | Title Company |
|---|---|---|---|
| Angel & Noor Co | -- | Great American Title Co | |
| Prosperity Bank | -- | None Available | |
| Caros Randall H | -- | American Title Company | |
| Gros Randall H | -- | None Available |
Source: Public Records
Mortgage History
| Date | Status | Borrower | Loan Amount |
|---|---|---|---|
| Previous Owner | Prosperity Bank | $26,000 |
Source: Public Records
Tax History
| Year | Tax Paid | Tax Assessment Tax Assessment Total Assessment is a certain percentage of the fair market value that is determined by local assessors to be the total taxable value of land and additions on the property. | Land | Improvement |
|---|---|---|---|---|
| 2025 | $2,789 | $173,050 | $21,000 | $152,050 |
| 2023 | $2,789 | $189,300 | $19,130 | $170,170 |
| 2022 | $2,474 | $109,540 | $16,880 | $92,660 |
| 2021 | $2,239 | $95,000 | $14,630 | $80,370 |
| 2020 | $2,288 | $92,500 | $13,500 | $79,000 |
| 2019 | $2,327 | $91,150 | $8,130 | $83,020 |
| 2018 | $2,223 | $86,610 | $9,750 | $76,860 |
| 2017 | $2,256 | $85,000 | $9,750 | $75,250 |
| 2016 | $1,871 | $70,500 | $8,130 | $62,370 |
| 2015 | $1,265 | $67,490 | $8,130 | $59,360 |
| 2014 | $1,265 | $47,130 | $8,130 | $39,000 |
Source: Public Records
Map
Nearby Homes
Your Personal Tour Guide
Ask me questions while you tour the home.