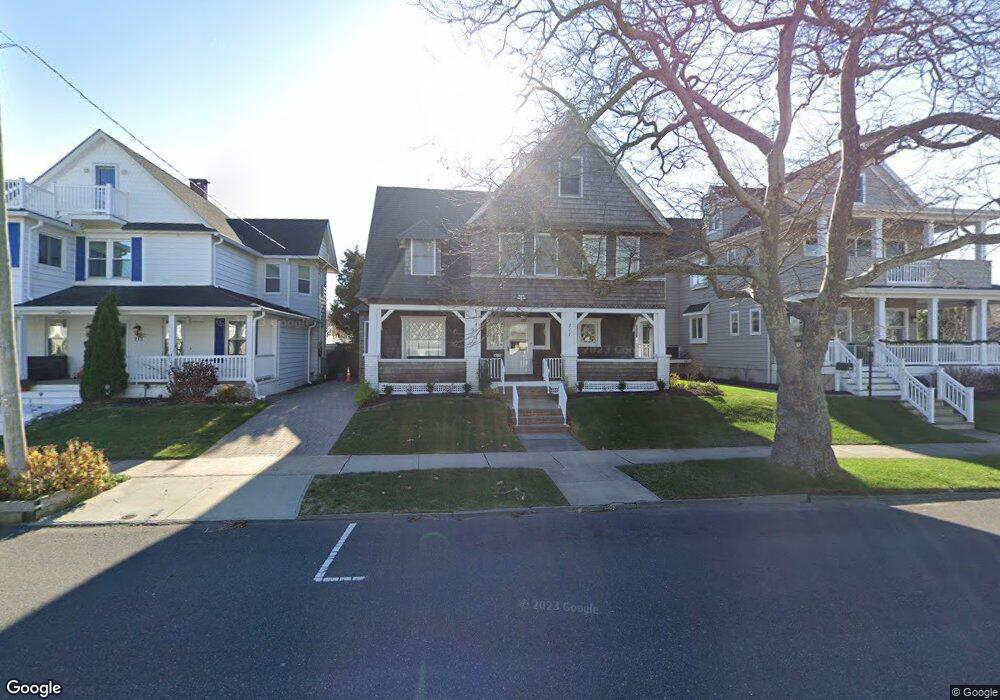
217 7th Ave Belmar, NJ 07719
Estimated Value: $1,417,568 - $1,880,000
4
Beds
2
Baths
2,070
Sq Ft
$812/Sq Ft
Est. Value
About This Home
This home is located at 217 7th Ave, Belmar, NJ 07719 and is currently estimated at $1,680,892, approximately $812 per square foot. 217 7th Ave is a home located in Monmouth County with nearby schools including Belmar Elementary School, St. Rose Grammar School, and St Rose High School.
Ownership History
Date
Name
Owned For
Owner Type
Purchase Details
Closed on
Apr 20, 2010
Sold by
Land Warren K and Land Joan Marie
Bought by
Grissom Lee M and Grissom Patricia E
Current Estimated Value
Home Financials for this Owner
Home Financials are based on the most recent Mortgage that was taken out on this home.
Original Mortgage
$417,000
Interest Rate
4.38%
Mortgage Type
New Conventional
Purchase Details
Closed on
Aug 11, 2003
Sold by
Trace Jesse
Bought by
Land Joan and Land Warren
Create a Home Valuation Report for This Property
The Home Valuation Report is an in-depth analysis detailing your home's value as well as a comparison with similar homes in the area
Home Values in the Area
Average Home Value in this Area
Purchase History
| Date | Buyer | Sale Price | Title Company |
|---|---|---|---|
| Grissom Lee M | $863,000 | First American Title Ins Co | |
| Land Joan | $744,000 | -- |
Source: Public Records
Mortgage History
| Date | Status | Borrower | Loan Amount |
|---|---|---|---|
| Closed | Grissom Lee M | $417,000 |
Source: Public Records
Tax History Compared to Growth
Tax History
| Year | Tax Paid | Tax Assessment Tax Assessment Total Assessment is a certain percentage of the fair market value that is determined by local assessors to be the total taxable value of land and additions on the property. | Land | Improvement |
|---|---|---|---|---|
| 2025 | $11,596 | $797,000 | $550,000 | $247,000 |
| 2024 | $11,206 | $797,000 | $550,000 | $247,000 |
| 2023 | $11,206 | $797,000 | $550,000 | $247,000 |
| 2022 | $10,815 | $797,000 | $550,000 | $247,000 |
| 2021 | $10,815 | $797,000 | $550,000 | $247,000 |
| 2020 | $10,720 | $797,000 | $550,000 | $247,000 |
| 2019 | $10,720 | $797,000 | $550,000 | $247,000 |
| 2018 | $9,843 | $797,000 | $550,000 | $247,000 |
| 2017 | $9,604 | $797,000 | $550,000 | $247,000 |
| 2016 | $8,664 | $453,400 | $250,000 | $203,400 |
| 2015 | $8,701 | $453,400 | $250,000 | $203,400 |
| 2014 | $8,580 | $443,400 | $240,000 | $203,400 |
Source: Public Records
Map
Nearby Homes