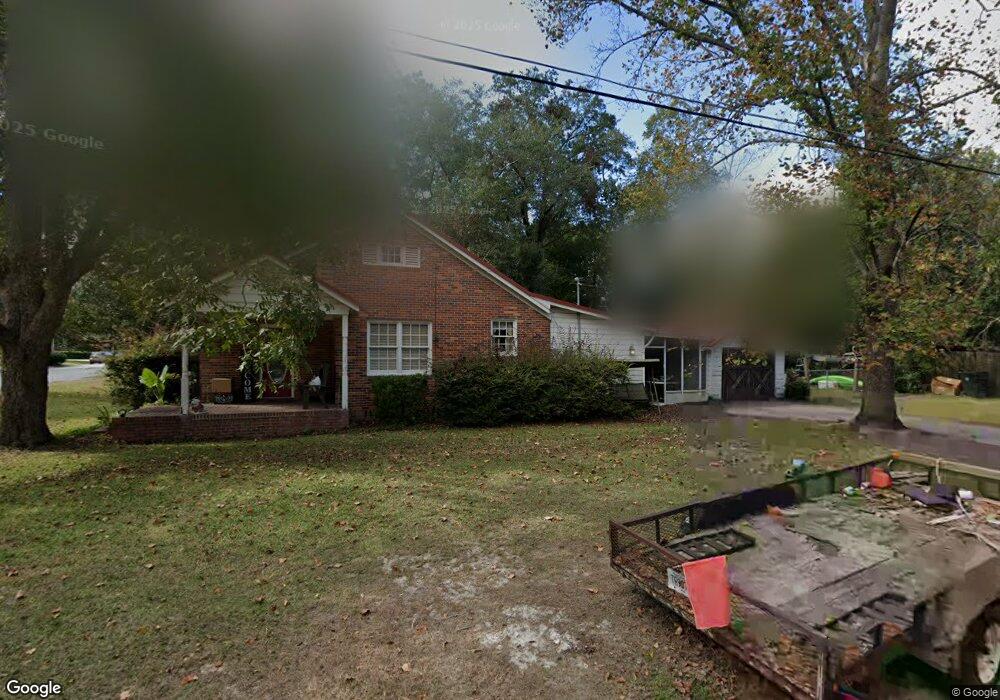
217 Baltimore Ave Waycross, GA 31501
Estimated Value: $132,804 - $173,000
3
Beds
1
Bath
1,536
Sq Ft
$103/Sq Ft
Est. Value
About This Home
This home is located at 217 Baltimore Ave, Waycross, GA 31501 and is currently estimated at $158,951, approximately $103 per square foot. 217 Baltimore Ave is a home located in Ware County with nearby schools including Williams Heights Elementary School, Waycross Middle School, and Ware County High School.
Ownership History
Date
Name
Owned For
Owner Type
Purchase Details
Closed on
Jul 8, 2008
Sold by
Carrin Michael A
Bought by
Wood James B
Current Estimated Value
Home Financials for this Owner
Home Financials are based on the most recent Mortgage that was taken out on this home.
Original Mortgage
$61,900
Outstanding Balance
$44,562
Interest Rate
6.27%
Mortgage Type
New Conventional
Estimated Equity
$114,389
Purchase Details
Closed on
Feb 5, 2008
Sold by
Wesner and Sainvil Sylvie Sainvil
Bought by
Bell Tree Farm Inc
Purchase Details
Closed on
Aug 10, 2006
Sold by
Mills James Michael
Bought by
Carrin Michael A and Carrin Robin S
Home Financials for this Owner
Home Financials are based on the most recent Mortgage that was taken out on this home.
Original Mortgage
$85,050
Interest Rate
10.4%
Mortgage Type
New Conventional
Purchase Details
Closed on
Jun 27, 2002
Sold by
Stipe Stuart and Stipe Summe
Bought by
Mills James Michael
Purchase Details
Closed on
May 11, 1998
Sold by
Lanier Robert G
Bought by
Stipe Stuart and Stipe Summe
Create a Home Valuation Report for This Property
The Home Valuation Report is an in-depth analysis detailing your home's value as well as a comparison with similar homes in the area
Home Values in the Area
Average Home Value in this Area
Purchase History
| Date | Buyer | Sale Price | Title Company |
|---|---|---|---|
| Wood James B | $58,000 | -- | |
| Bell Tree Farm Inc | -- | -- | |
| Carrin Michael A | $94,500 | -- | |
| Mills James Michael | $59,000 | -- | |
| Stipe Stuart | $39,500 | -- |
Source: Public Records
Mortgage History
| Date | Status | Borrower | Loan Amount |
|---|---|---|---|
| Open | Wood James B | $61,900 | |
| Previous Owner | Carrin Michael A | $85,050 |
Source: Public Records
Tax History Compared to Growth
Tax History
| Year | Tax Paid | Tax Assessment Tax Assessment Total Assessment is a certain percentage of the fair market value that is determined by local assessors to be the total taxable value of land and additions on the property. | Land | Improvement |
|---|---|---|---|---|
| 2024 | $1,023 | $48,136 | $4,640 | $43,496 |
| 2023 | $1,044 | $40,838 | $5,413 | $35,425 |
| 2022 | $1,195 | $40,910 | $5,413 | $35,497 |
| 2021 | $1,228 | $34,045 | $5,413 | $28,632 |
| 2020 | $1,237 | $32,641 | $5,413 | $27,228 |
| 2019 | $1,255 | $30,535 | $5,413 | $25,122 |
| 2018 | $1,258 | $29,657 | $5,413 | $24,244 |
| 2017 | $1,228 | $29,657 | $5,413 | $24,244 |
| 2016 | $1,228 | $29,657 | $5,413 | $24,244 |
| 2015 | $1,236 | $29,657 | $5,413 | $24,244 |
| 2014 | $1,235 | $29,658 | $5,413 | $24,244 |
| 2013 | -- | $30,690 | $5,413 | $25,276 |
Source: Public Records
Map
Nearby Homes
- 807 College St
- 511 Richmond Ave
- 1101 Cherokee Dr
- 506 Magnolia Dr
- 707 Euclid Ave
- 808 Satilla Blvd
- 1405 Grove Ave
- .22 Alice St
- 1701 Satilla Blvd
- 0 Saint Marys Dr Unit (TRACT 2 0.25 ACRES)
- 301 Riverside Dr
- 415 Dewey St
- 1500 Saint Marys Dr
- 713 Magnolia Dr
- 706 Cherokee Cir
- 502 Dewey St
- 1504 Habersham Dr
- 310 Butler St
- 907 Euclid Ave
- 903 Atlantic Ave
- 211 Baltimore Ave
- 301 Baltimore Ave
- 208 Pennsylvania Ave
- 206 Pennsylvania Ave
- 207 Baltimore Ave
- 204 Pennsylvania Ave
- 1003 College St
- 300 Pennsylvania Ave
- 303 Baltimore Ave
- 214 Baltimore Ave
- 202 Pennsylvania Ave
- 1004 College St
- 205 Baltimore Ave
- 302 Pennsylvania Ave
- 0 Pennsylvania Ave
- 210 Baltimore Ave
- 304 Baltimore Ave
- 1211 Scruggs St
- 1206 Screven Ave
- 1201 Scruggs St