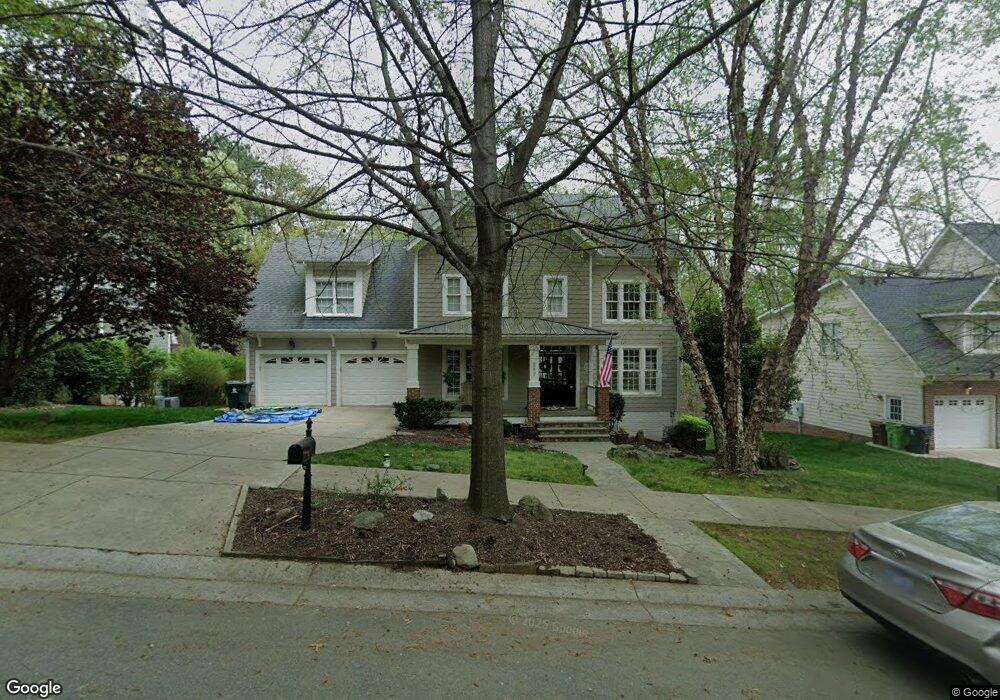
217 Branchside Ln Holly Springs, NC 27540
Estimated Value: $823,000 - $863,000
5
Beds
5
Baths
3,745
Sq Ft
$223/Sq Ft
Est. Value
About This Home
This home is located at 217 Branchside Ln, Holly Springs, NC 27540 and is currently estimated at $834,077, approximately $222 per square foot. 217 Branchside Ln is a home located in Wake County with nearby schools including Holly Springs Elementary School, Holly Ridge Middle School, and Holly Springs High School.
Ownership History
Date
Name
Owned For
Owner Type
Purchase Details
Closed on
Oct 27, 2017
Sold by
Butner Sidney T and Butner Deborah A
Bought by
Foxworth Robert W and Foxworth Rachel Sd
Current Estimated Value
Purchase Details
Closed on
Jun 10, 2009
Sold by
Grund Jeffrey S and Grund Marsha A
Bought by
Butner Sidney T and Butner Deborah A
Home Financials for this Owner
Home Financials are based on the most recent Mortgage that was taken out on this home.
Original Mortgage
$403,750
Interest Rate
4.77%
Mortgage Type
New Conventional
Purchase Details
Closed on
Jul 25, 2005
Sold by
Whg Inc
Bought by
Grund Jeffrey S and Grund Marsha A
Home Financials for this Owner
Home Financials are based on the most recent Mortgage that was taken out on this home.
Original Mortgage
$180,000
Interest Rate
5.51%
Mortgage Type
Fannie Mae Freddie Mac
Create a Home Valuation Report for This Property
The Home Valuation Report is an in-depth analysis detailing your home's value as well as a comparison with similar homes in the area
Home Values in the Area
Average Home Value in this Area
Purchase History
| Date | Buyer | Sale Price | Title Company |
|---|---|---|---|
| Foxworth Robert W | $490,000 | None Available | |
| Butner Sidney T | $425,000 | None Available | |
| Butner Sidney T | $425,000 | None Available | |
| Grund Jeffrey S | $479,000 | None Available |
Source: Public Records
Mortgage History
| Date | Status | Borrower | Loan Amount |
|---|---|---|---|
| Previous Owner | Butner Sidney T | $403,750 | |
| Previous Owner | Grund Jeffrey S | $180,000 |
Source: Public Records
Tax History Compared to Growth
Tax History
| Year | Tax Paid | Tax Assessment Tax Assessment Total Assessment is a certain percentage of the fair market value that is determined by local assessors to be the total taxable value of land and additions on the property. | Land | Improvement |
|---|---|---|---|---|
| 2025 | $6,217 | $720,107 | $150,000 | $570,107 |
| 2024 | $6,191 | $720,107 | $150,000 | $570,107 |
| 2023 | $5,403 | $499,098 | $80,000 | $419,098 |
| 2022 | $5,216 | $499,098 | $80,000 | $419,098 |
| 2021 | $5,119 | $499,098 | $80,000 | $419,098 |
| 2020 | $5,119 | $499,098 | $80,000 | $419,098 |
| 2019 | $5,538 | $458,645 | $71,250 | $387,395 |
| 2018 | $5,005 | $458,645 | $71,250 | $387,395 |
| 2017 | $4,824 | $458,645 | $71,250 | $387,395 |
| 2016 | $4,758 | $458,645 | $71,250 | $387,395 |
| 2015 | $5,455 | $513,942 | $80,750 | $433,192 |
| 2014 | $5,226 | $513,942 | $80,750 | $433,192 |
Source: Public Records
Map
Nearby Homes
- 204 Chrismill Ln
- 228 Masden Rd
- 112 Midden Way
- 0 Old Ride Dr
- 225 Old Ride Dr
- 208 Apple Drupe Way
- 208 Old Ride Dr
- 217 Jones Hill Rd
- 413 Rhamkatte Rd
- 116 Cobblebrook Ct
- 401 Wellspring Dr
- 112 Sanchez Ct
- 305 Wellspring Dr
- 108 Warm Wood Ln
- 0/416 Holly Springs Rd
- 138 Cobalt Creek Way
- 204 Crossway Ln
- 129 Starwood Ln
- 329 N Main St
- 215 Savannah Ridge Rd Unit 215
- 213 Branchside Ln
- 221 Branchside Ln
- 209 Branchside Ln
- 220 Branchside Ln
- 216 Branchside Ln
- 224 Branchside Ln
- 232 Midden Way
- 236 Midden Way
- 228 Midden Way
- 205 Branchside Ln
- 240 Midden Way
- 212 Branchside Ln
- 228 Branchside Ln
- 208 Branchside Ln
- 220 Midden Way
- 105 Cliffcreek Dr
- 300 Midden Way
- 201 Branchside Ln
- 309 Chrismill Ln
- 109 Cliffcreek Dr