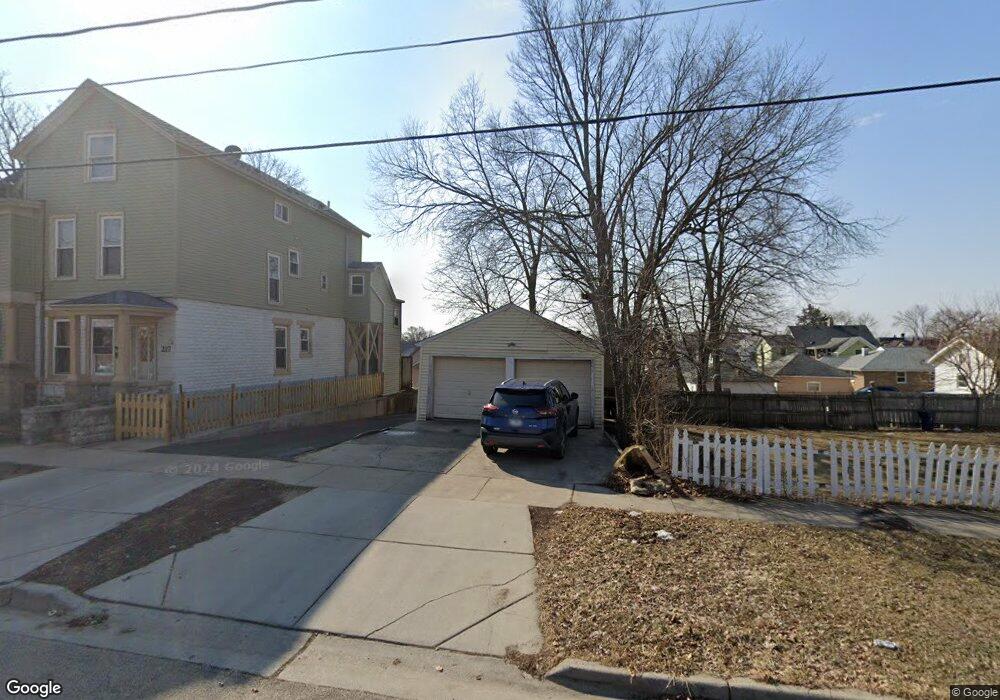
217 Cherry St Unit 19 Elgin, IL 60120
Northeast Elgin NeighborhoodEstimated Value: $271,000 - $329,000
5
Beds
3
Baths
2,152
Sq Ft
$139/Sq Ft
Est. Value
About This Home
This home is located at 217 Cherry St Unit 19, Elgin, IL 60120 and is currently estimated at $298,425, approximately $138 per square foot. 217 Cherry St Unit 19 is a home located in Kane County with nearby schools including Ronald D O'Neal Elementary School, Kimball Middle School, and Larkin High School.
Ownership History
Date
Name
Owned For
Owner Type
Purchase Details
Closed on
Mar 12, 2014
Sold by
U S Bank National Association
Bought by
Zepeda Efrain
Current Estimated Value
Purchase Details
Closed on
Sep 23, 2013
Sold by
Buczkowski Dina
Bought by
Us Bank Na and Arm T2005 7
Purchase Details
Closed on
Sep 17, 1997
Sold by
Ramirez Reynaldo and Ramirez Juana
Bought by
Buczkowski Dina
Home Financials for this Owner
Home Financials are based on the most recent Mortgage that was taken out on this home.
Original Mortgage
$115,500
Interest Rate
6.92%
Create a Home Valuation Report for This Property
The Home Valuation Report is an in-depth analysis detailing your home's value as well as a comparison with similar homes in the area
Home Values in the Area
Average Home Value in this Area
Purchase History
| Date | Buyer | Sale Price | Title Company |
|---|---|---|---|
| Zepeda Efrain | $74,000 | Stewart Title Company | |
| Us Bank Na | -- | None Available | |
| Buczkowski Dina | $100,000 | -- |
Source: Public Records
Mortgage History
| Date | Status | Borrower | Loan Amount |
|---|---|---|---|
| Previous Owner | Buczkowski Dina | $115,500 |
Source: Public Records
Tax History
| Year | Tax Paid | Tax Assessment Tax Assessment Total Assessment is a certain percentage of the fair market value that is determined by local assessors to be the total taxable value of land and additions on the property. | Land | Improvement |
|---|---|---|---|---|
| 2024 | $6,765 | $84,533 | $6,816 | $77,717 |
| 2023 | $6,510 | $76,369 | $6,158 | $70,211 |
| 2022 | $5,533 | $63,815 | $5,615 | $58,200 |
| 2021 | $5,323 | $59,663 | $5,250 | $54,413 |
| 2020 | $5,195 | $56,958 | $5,012 | $51,946 |
| 2019 | $5,067 | $54,256 | $4,774 | $49,482 |
| 2018 | $5,053 | $51,112 | $4,497 | $46,615 |
| 2017 | $4,970 | $48,319 | $4,251 | $44,068 |
| 2016 | $4,781 | $44,827 | $3,944 | $40,883 |
| 2015 | -- | $41,088 | $3,615 | $37,473 |
| 2014 | -- | $40,580 | $3,570 | $37,010 |
| 2013 | -- | $41,650 | $3,664 | $37,986 |
Source: Public Records
Map
Nearby Homes
- 464 Prospect St
- 363 Franklin Blvd
- 603 Douglas Ave
- 268 N Gifford St
- 131 N Gifford St
- 409 Algona Ave
- 453 Addison St
- 841 Douglas Ave
- 216 Prairie St
- 851 N Grove Ave
- 211 Prairie St
- 643 Wing St
- 9 N Jackson St
- 162 Festival Ct
- 920 Augusta Ave
- 115 N Porter St
- 96 S Crystal St
- 705 W Highland Ave
- 601 Columbia Ave
- 277 Gifford Place
Your Personal Tour Guide
Ask me questions while you tour the home.