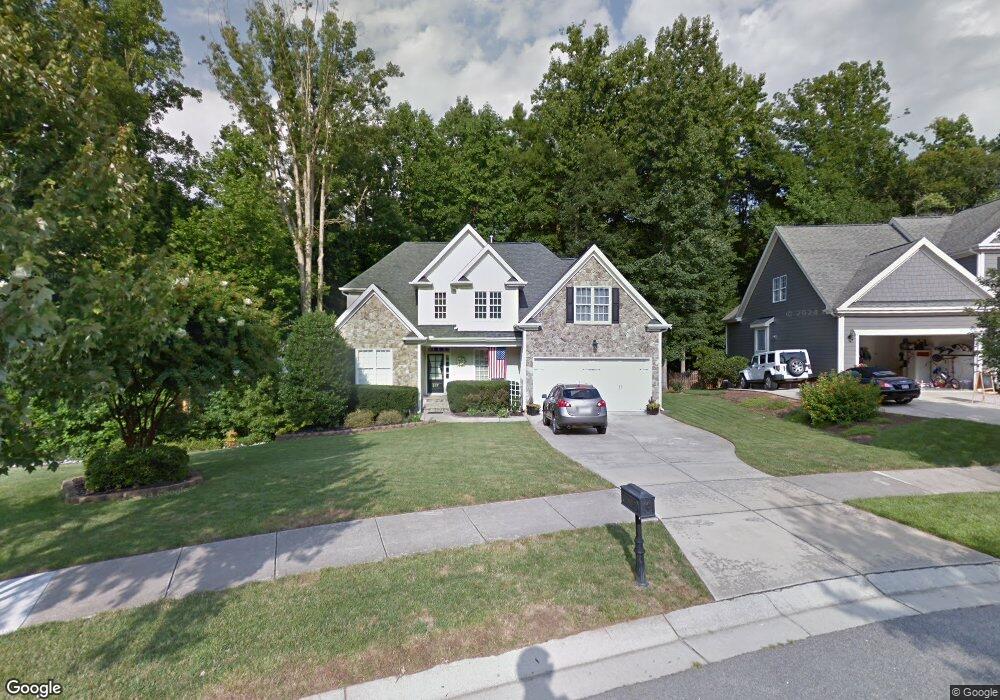
217 Cobblepoint Way Holly Springs, NC 27540
Estimated Value: $653,674 - $724,000
3
Beds
4
Baths
2,714
Sq Ft
$256/Sq Ft
Est. Value
About This Home
This home is located at 217 Cobblepoint Way, Holly Springs, NC 27540 and is currently estimated at $693,669, approximately $255 per square foot. 217 Cobblepoint Way is a home located in Wake County with nearby schools including Holly Ridge Elementary School, Holly Ridge Middle School, and Holly Springs High School.
Ownership History
Date
Name
Owned For
Owner Type
Purchase Details
Closed on
Dec 6, 2013
Sold by
George Robert E and George Judy L
Bought by
Crowl Charles Thomas and Crowl Cathy Lynn
Current Estimated Value
Home Financials for this Owner
Home Financials are based on the most recent Mortgage that was taken out on this home.
Original Mortgage
$268,000
Outstanding Balance
$199,678
Interest Rate
4.13%
Mortgage Type
New Conventional
Estimated Equity
$493,991
Purchase Details
Closed on
Mar 11, 2005
Sold by
Reward Builders Inc
Bought by
George Robert E and George Judy L
Home Financials for this Owner
Home Financials are based on the most recent Mortgage that was taken out on this home.
Original Mortgage
$270,400
Interest Rate
5.12%
Mortgage Type
Fannie Mae Freddie Mac
Create a Home Valuation Report for This Property
The Home Valuation Report is an in-depth analysis detailing your home's value as well as a comparison with similar homes in the area
Home Values in the Area
Average Home Value in this Area
Purchase History
| Date | Buyer | Sale Price | Title Company |
|---|---|---|---|
| Crowl Charles Thomas | $335,000 | None Available | |
| George Robert E | $338,000 | -- |
Source: Public Records
Mortgage History
| Date | Status | Borrower | Loan Amount |
|---|---|---|---|
| Open | Crowl Charles Thomas | $268,000 | |
| Previous Owner | George Robert E | $270,400 | |
| Closed | George Robert E | $33,800 |
Source: Public Records
Tax History Compared to Growth
Tax History
| Year | Tax Paid | Tax Assessment Tax Assessment Total Assessment is a certain percentage of the fair market value that is determined by local assessors to be the total taxable value of land and additions on the property. | Land | Improvement |
|---|---|---|---|---|
| 2025 | $5,253 | $608,022 | $120,000 | $488,022 |
| 2024 | $5,231 | $608,022 | $120,000 | $488,022 |
| 2023 | $4,154 | $383,310 | $50,000 | $333,310 |
| 2022 | $4,011 | $383,310 | $50,000 | $333,310 |
| 2021 | $3,936 | $383,310 | $50,000 | $333,310 |
| 2020 | $3,936 | $383,310 | $50,000 | $333,310 |
| 2019 | $3,949 | $326,583 | $50,000 | $276,583 |
| 2018 | $3,570 | $326,583 | $50,000 | $276,583 |
| 2017 | $3,441 | $326,583 | $50,000 | $276,583 |
| 2016 | $3,394 | $326,583 | $50,000 | $276,583 |
| 2015 | $3,762 | $356,594 | $51,000 | $305,594 |
| 2014 | $3,632 | $356,594 | $51,000 | $305,594 |
Source: Public Records
Map
Nearby Homes
- 112 Midden Way
- 0/416 Holly Springs Rd
- 228 Masden Rd
- 204 Crossway Ln
- 215 Savannah Ridge Rd Unit 215
- 225 Old Ride Dr
- 305 Savannah Ridge Rd
- 129 Starwood Ln
- 0 Old Ride Dr
- 208 Old Ride Dr
- 217 Jones Hill Rd
- 413 Rhamkatte Rd
- 204 Chrismill Ln
- 4809 Greenpoint Ln
- 5200 Gable Ridge Ln
- 116 Cabrita Ct
- 5620 Lockley Rd
- 208 Apple Drupe Way
- 109 Lacombe Ct
- 109 Willow View Ln
- 213 Cobblepoint Way
- 221 Cobblepoint Way
- 209 Cobblepoint Way
- 212 Cobblepoint Way
- 229 Cobblepoint Way
- 205 Cobblepoint Way
- 225 Cobblepoint Way
- 204 Cobblepoint Way
- 312 Landbridge Ln
- 201 Cobblepoint Way
- 224 Cobblepoint Way
- 220 Cobblepoint Way
- 308 Landbridge Ln
- 229 Kingsport Rd
- 216 Cobblepoint Way
- 225 Kingsport Rd
- 400 Landbridge Ln
- 304 Landbridge Ln
- 233 Kingsport Rd
- 221 Kingsport Rd