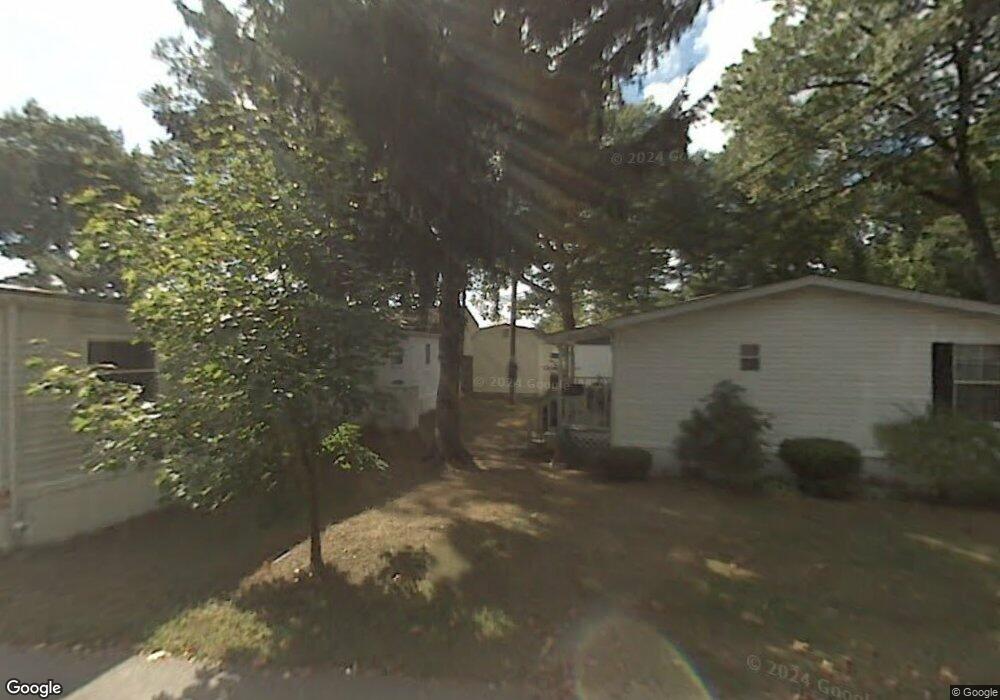
217 Dunham St Southington, CT 06489
East Southington NeighborhoodEstimated Value: $455,000
3
Beds
2
Baths
2,306
Sq Ft
$197/Sq Ft
Est. Value
About This Home
This home is located at 217 Dunham St, Southington, CT 06489 and is currently priced at $455,000, approximately $197 per square foot. 217 Dunham St is a home located in Hartford County with nearby schools including Reuben E. Thalberg Elementary School, Joseph A. Depaolo Middle School, and Southington High School.
Ownership History
Date
Name
Owned For
Owner Type
Purchase Details
Closed on
Jan 6, 2021
Sold by
Patt Joan Est T
Bought by
Leclair Marc G and King Ashley
Current Estimated Value
Purchase Details
Closed on
Aug 12, 2009
Sold by
Tompkins Shirley S
Bought by
Apple Calley Village
Purchase Details
Closed on
Sep 16, 2008
Sold by
Goldstar Homes
Bought by
Couture Suzanne M
Purchase Details
Closed on
Aug 23, 2007
Sold by
Plaza Mobile & Modular I
Bought by
Vazquez Hector L
Purchase Details
Closed on
Jan 4, 2007
Sold by
Plaza Mobile & Modular I
Bought by
Romeo Heather
Purchase Details
Closed on
May 25, 2006
Sold by
Bartosiewicz Sharon
Bought by
Barber Joseph
Purchase Details
Closed on
Jul 9, 2003
Sold by
Forney Lois C
Bought by
Bartosiewicz Sharon
Create a Home Valuation Report for This Property
The Home Valuation Report is an in-depth analysis detailing your home's value as well as a comparison with similar homes in the area
Home Values in the Area
Average Home Value in this Area
Purchase History
| Date | Buyer | Sale Price | Title Company |
|---|---|---|---|
| Leclair Marc G | -- | None Available | |
| Apple Calley Village | -- | -- | |
| Apple Calley Village | -- | -- | |
| Couture Suzanne M | $95,000 | -- | |
| Couture Suzanne M | $95,000 | -- | |
| Vazquez Hector L | $79,900 | -- | |
| Vazquez Hector L | $79,900 | -- | |
| Romeo Heather | $84,685 | -- | |
| Romeo Heather | $84,685 | -- | |
| Barber Joseph | $25,000 | -- | |
| Barber Joseph | $25,000 | -- | |
| Bartosiewicz Sharon | $20,000 | -- | |
| Bartosiewicz Sharon | $20,000 | -- |
Source: Public Records
Mortgage History
| Date | Status | Borrower | Loan Amount |
|---|---|---|---|
| Previous Owner | Bartosiewicz Sharon | $27,500 |
Source: Public Records
Tax History Compared to Growth
Tax History
| Year | Tax Paid | Tax Assessment Tax Assessment Total Assessment is a certain percentage of the fair market value that is determined by local assessors to be the total taxable value of land and additions on the property. | Land | Improvement |
|---|---|---|---|---|
| 2025 | $29,073 | $875,440 | $330,740 | $544,700 |
| 2024 | $27,524 | $875,440 | $330,740 | $544,700 |
| 2023 | $26,578 | $875,440 | $330,740 | $544,700 |
| 2022 | $25,502 | $875,440 | $330,740 | $544,700 |
| 2021 | $25,414 | $875,440 | $330,740 | $544,700 |
| 2020 | $23,844 | $778,450 | $258,360 | $520,090 |
| 2019 | $23,852 | $778,450 | $258,360 | $520,090 |
| 2018 | $23,727 | $778,450 | $258,360 | $520,090 |
| 2017 | $23,727 | $778,450 | $258,360 | $520,090 |
| 2016 | $23,073 | $778,450 | $258,360 | $520,090 |
| 2015 | $17,249 | $591,950 | $268,120 | $323,830 |
| 2014 | $16,788 | $591,950 | $268,120 | $323,830 |
Source: Public Records
Map
Nearby Homes
- 46 Rethal St
- 32 Minthal Dr
- 228 Pattonwood Dr
- 15 Mountain View Dr
- 45 Quail Hollow Dr
- 452 East St
- 26 Mountain View Dr
- 10 Terra Rd
- 1198 Flanders Rd
- 27 Brookside Dr
- 309 East St Unit 10
- 16 Brookside Dr
- 81 Laning St
- 10 Meadow Rd
- 7 Meadow Rd
- 189 Redstone Hill Rd Unit 7
- 300 Captain Lewis Dr
- 320 Captain Lewis Dr
- 300 & 320 Captain Lewis Dr
- 285 Queen St Unit 10I
- 217 Dunham St
- 217 Dunham St Unit 30
- 217 Dunham St Unit 15
- 217 Dunham St Unit 28
- 217 Dunham St Unit TRLR 38
- 217 Dunham St Unit 17
- 217 Dunham St Unit 23
- 217 Dunham St
- 217 Dunham St
- 217 Dunham St Unit 13
- 217 Dunham St Unit 10
- 217 Dunham St Unit 4
- 217 Dunham St Unit 2
- 217 Dunham St Unit 3
- 217 Dunham St Unit 38
- 217 Dunham St Unit 16
- 217 Dunham St Unit 35
- 217 Dunham St Unit 34
- 217 Dunham St Unit 32
- 217 Dunham St Unit 20