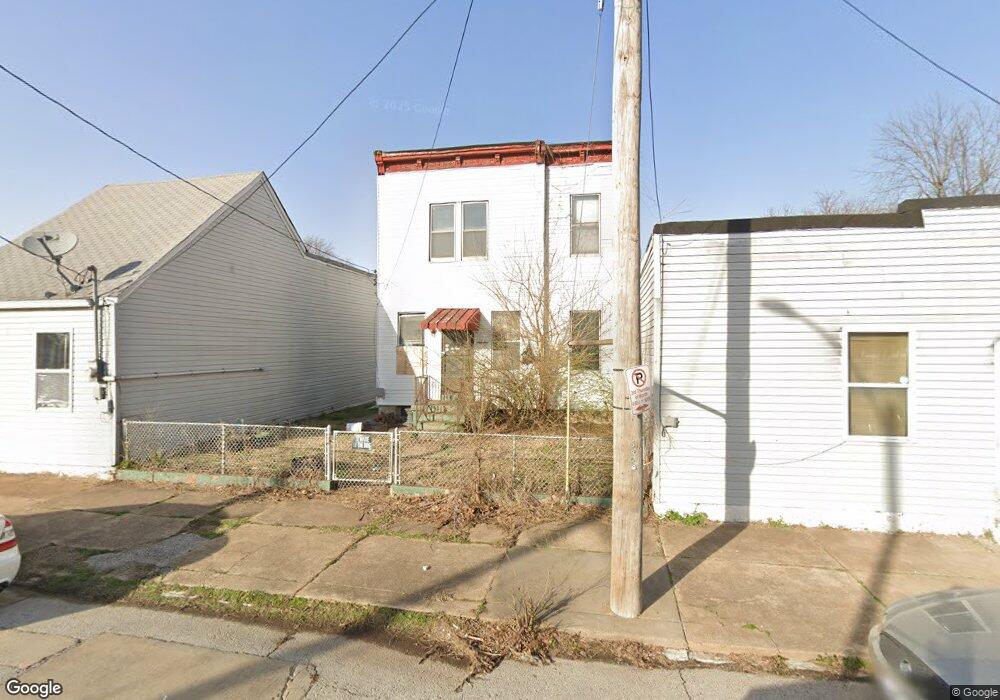
217 E Schirmer St Saint Louis, MO 63111
Patch NeighborhoodEstimated Value: $59,192 - $114,000
--
Bed
1
Bath
1,248
Sq Ft
$70/Sq Ft
Est. Value
About This Home
This home is located at 217 E Schirmer St, Saint Louis, MO 63111 and is currently estimated at $87,548, approximately $70 per square foot. 217 E Schirmer St is a home located in St. Louis City with nearby schools including Lyon at Blow Elementary School, Woerner Elementary School, and Roosevelt High School.
Ownership History
Date
Name
Owned For
Owner Type
Purchase Details
Closed on
Jun 5, 2024
Sold by
Whitmore Sandra M
Bought by
Land Reutilization Authority and Land C
Current Estimated Value
Purchase Details
Closed on
Sep 17, 2004
Sold by
Brown Lauther R and Whitmore Sandra M
Bought by
Brown Lauther R and Whitmore Sandra M
Home Financials for this Owner
Home Financials are based on the most recent Mortgage that was taken out on this home.
Original Mortgage
$4,000
Interest Rate
9.5%
Mortgage Type
Stand Alone Refi Refinance Of Original Loan
Purchase Details
Closed on
Jun 2, 1997
Sold by
Brown Arlie R and Brown Lauther R
Bought by
Brown Arlie R and Brown Lauther R
Home Financials for this Owner
Home Financials are based on the most recent Mortgage that was taken out on this home.
Original Mortgage
$7,000
Interest Rate
10%
Mortgage Type
Purchase Money Mortgage
Create a Home Valuation Report for This Property
The Home Valuation Report is an in-depth analysis detailing your home's value as well as a comparison with similar homes in the area
Home Values in the Area
Average Home Value in this Area
Purchase History
| Date | Buyer | Sale Price | Title Company |
|---|---|---|---|
| Land Reutilization Authority | -- | None Listed On Document | |
| Brown Lauther R | -- | -- | |
| Brown Arlie R | -- | -- |
Source: Public Records
Mortgage History
| Date | Status | Borrower | Loan Amount |
|---|---|---|---|
| Previous Owner | Brown Lauther R | $4,000 | |
| Previous Owner | Brown Arlie R | $7,000 |
Source: Public Records
Tax History Compared to Growth
Tax History
| Year | Tax Paid | Tax Assessment Tax Assessment Total Assessment is a certain percentage of the fair market value that is determined by local assessors to be the total taxable value of land and additions on the property. | Land | Improvement |
|---|---|---|---|---|
| 2025 | -- | $7,600 | $910 | $6,690 |
| 2024 | $216 | $2,360 | $910 | $1,450 |
| 2023 | $216 | $2,360 | $910 | $1,450 |
| 2022 | $215 | $2,260 | $910 | $1,350 |
| 2021 | $215 | $2,260 | $910 | $1,350 |
| 2020 | $207 | $2,190 | $910 | $1,280 |
| 2019 | $207 | $2,180 | $910 | $1,270 |
| 2018 | $206 | $2,110 | $910 | $1,200 |
| 2017 | $203 | $2,110 | $910 | $1,200 |
| 2016 | $205 | $2,110 | $910 | $1,200 |
| 2015 | $188 | $2,110 | $910 | $1,200 |
| 2014 | $185 | $2,110 | $910 | $1,200 |
| 2013 | -- | $2,070 | $910 | $1,160 |
Source: Public Records
Map
Nearby Homes
- 120 W Courtois St
- 7413 S Broadway
- 7914 S Broadway
- 214 W Steins St
- 7505 Pennsylvania Ave
- 7915 S Broadway
- 7514 Minnesota Ave
- 7326 Pennsylvania Ave
- 7700 Michigan Ave
- 7708 Michigan Ave
- 7301 Pennsylvania Ave
- 7220 Pennsylvania Ave
- 7310 Minnesota Ave
- 7227 Pennsylvania Ave
- 7617 Ivory Ave
- 7621 Virginia Ave
- 8213 S Broadway
- 7343 Virginia Ave
- 7226 Virginia Ave
- 7709 Vermont Ave
- 219 E Schirmer St
- 223 E Schirmer St
- 215 E Schirmer St
- 216 E Schirmer St
- 213 E Schirmer St
- 226 E Schirmer St
- 207 E Schirmer St
- 7700 Water St
- 7708 Water St
- 7710 Water St
- 218 E Steins St
- 222 E Steins St
- 214 E Steins St
- 7717 Vulcan St
- 7712 Water St
- 7709 Vulcan St
- 7714 Water 18-20 St
- 7714 Water St
- 7631 Water St
- 200 E Steins St