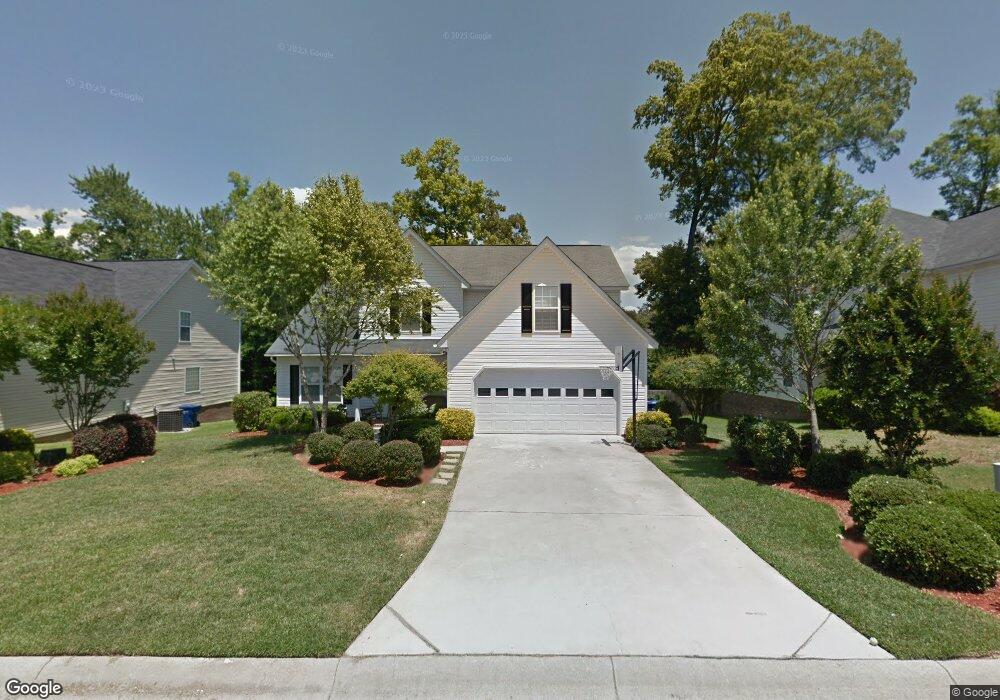
217 Elm Creek Ct Chapin, SC 29036
Estimated Value: $282,994 - $311,000
4
Beds
3
Baths
2,302
Sq Ft
$130/Sq Ft
Est. Value
About This Home
This home is located at 217 Elm Creek Ct, Chapin, SC 29036 and is currently estimated at $298,999, approximately $129 per square foot. 217 Elm Creek Ct is a home located in Lexington County with nearby schools including Chapin Elementary School, Chapin Intermediate, and Chapin High School.
Ownership History
Date
Name
Owned For
Owner Type
Purchase Details
Closed on
Nov 10, 2020
Sold by
Whittaker Bruce H and Whittaker Julie K
Bought by
Whittaker Bruce H and Whittaker Julie K
Current Estimated Value
Purchase Details
Closed on
Aug 9, 2019
Sold by
Forrester Elton
Bought by
Whittaker Bruce H and Whittaker Julie K
Home Financials for this Owner
Home Financials are based on the most recent Mortgage that was taken out on this home.
Original Mortgage
$171,000
Outstanding Balance
$149,857
Interest Rate
3.73%
Mortgage Type
New Conventional
Estimated Equity
$149,142
Purchase Details
Closed on
Jun 25, 2014
Sold by
Forrester Jennifer
Bought by
Forrester Elton
Purchase Details
Closed on
Dec 15, 2009
Sold by
Martin W Blair and Martin Sandy E
Bought by
Forrester Elton and Forrester Jennifer
Home Financials for this Owner
Home Financials are based on the most recent Mortgage that was taken out on this home.
Original Mortgage
$175,757
Interest Rate
5.5%
Mortgage Type
FHA
Create a Home Valuation Report for This Property
The Home Valuation Report is an in-depth analysis detailing your home's value as well as a comparison with similar homes in the area
Home Values in the Area
Average Home Value in this Area
Purchase History
| Date | Buyer | Sale Price | Title Company |
|---|---|---|---|
| Whittaker Bruce H | -- | None Available | |
| Whittaker Bruce H | $190,000 | None Available | |
| Forrester Elton | -- | -- | |
| Forrester Elton | $179,000 | -- |
Source: Public Records
Mortgage History
| Date | Status | Borrower | Loan Amount |
|---|---|---|---|
| Open | Whittaker Bruce H | $171,000 | |
| Previous Owner | Forrester Elton | $175,757 |
Source: Public Records
Tax History Compared to Growth
Tax History
| Year | Tax Paid | Tax Assessment Tax Assessment Total Assessment is a certain percentage of the fair market value that is determined by local assessors to be the total taxable value of land and additions on the property. | Land | Improvement |
|---|---|---|---|---|
| 2024 | $5,480 | $11,400 | $1,500 | $9,900 |
| 2023 | $4,939 | $11,400 | $1,500 | $9,900 |
| 2022 | $4,703 | $11,400 | $1,500 | $9,900 |
| 2020 | $4,783 | $11,400 | $1,500 | $9,900 |
| 2019 | $1,067 | $6,493 | $1,000 | $5,493 |
| 2018 | $939 | $6,493 | $1,000 | $5,493 |
| 2017 | $915 | $6,493 | $1,000 | $5,493 |
| 2016 | $938 | $6,492 | $1,000 | $5,492 |
| 2014 | $1,031 | $7,159 | $1,200 | $5,959 |
| 2013 | -- | $7,160 | $1,200 | $5,960 |
Source: Public Records
Map
Nearby Homes
- 129 Monroe Preserve Dr
- 0 Mainsail Ln Unit 622256
- 0 Dreher Island Rd Unit 21647709
- 0 Dreher Island Rd Unit 587193
- 153 Rushton Dr
- 125 Northshore Dr
- 100 Palm St
- 228 Bickley View Ct
- 412 Northshore Ct
- 814 Dutchmaster Dr
- 1431 Saugus Ct
- 117 Bay Front Dr
- 147 Stuck's Point
- 417 Northshore Ct
- 357 Chapin Place Way
- 358 Chapin Place Way
- 354 Chapin Place Way
- 338 Chapin Place Way
- 330 Chapin Place Way
- 326 Chapin Place Way
- 221 Elm Creek Ct
- 213 Elm Creek Ct
- tbd Resting Place
- 194 Elm Creek Dr
- 961 Bergenfield Ln
- 225 Elm Creek Ct
- 198 Elm Creek Dr
- 209 Elm Creek Ct
- 218 Elm Creek Ct
- 224 Elm Creek Ct
- 212 Elm Creek Ct
- 205 Elm Creek Ct
- 190 Elm Creek Dr
- 206 Elm Creek Ct
- 229 Elm Creek Ct
- 230 Elm Creek Ct
- 2409 Hadley Crossing
- 2367 Hadley Crossing
- 150 Elm Creek Dr
- 134 Elm Creek Dr