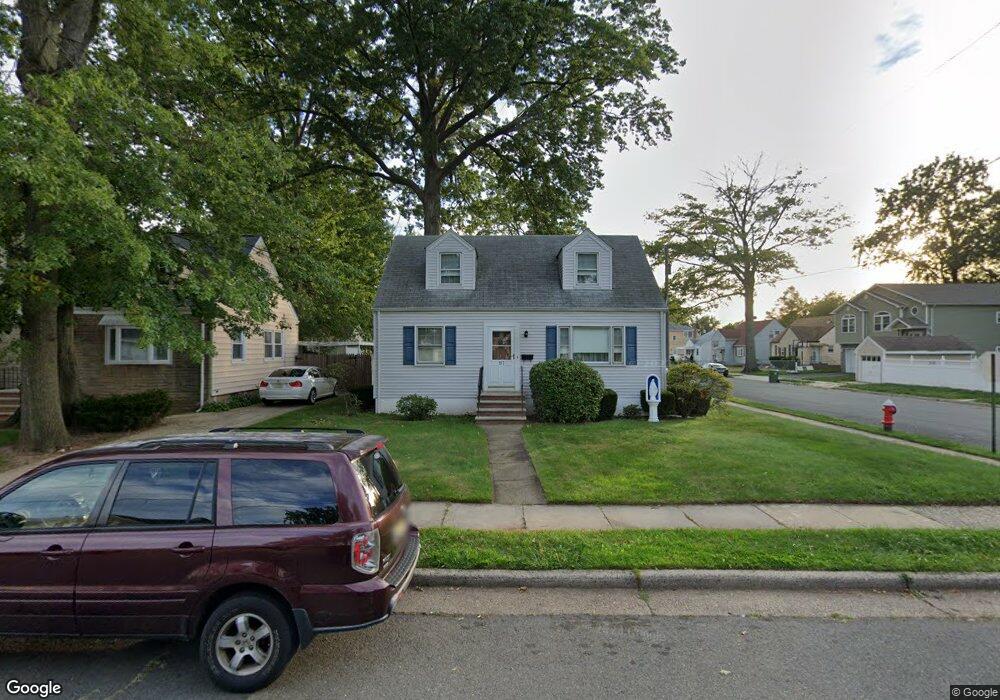
217 Grant St Linden, NJ 07036
Estimated Value: $375,000 - $475,381
--
Bed
--
Bath
1,152
Sq Ft
$376/Sq Ft
Est. Value
About This Home
This home is located at 217 Grant St, Linden, NJ 07036 and is currently estimated at $433,345, approximately $376 per square foot. 217 Grant St is a home located in Union County with nearby schools including School No. 4, Joseph E. Soehl Middle School, and Linden High School.
Ownership History
Date
Name
Owned For
Owner Type
Purchase Details
Closed on
Apr 29, 2025
Sold by
Pietrzak Edward and Glynn Dominick J
Bought by
Soca Development Llc
Current Estimated Value
Purchase Details
Closed on
Aug 13, 2014
Sold by
Yurcisin Irene
Bought by
Pietrzak Edward
Purchase Details
Closed on
Nov 18, 2010
Sold by
Pietrzak Edward and Pietrzak Joseph
Bought by
Pietrzak Edward and Yurcisin Irene
Purchase Details
Closed on
Jul 20, 2005
Sold by
Yurcisin Irene
Bought by
Pietrzak Edward and Pietrzak Joseph
Create a Home Valuation Report for This Property
The Home Valuation Report is an in-depth analysis detailing your home's value as well as a comparison with similar homes in the area
Home Values in the Area
Average Home Value in this Area
Purchase History
| Date | Buyer | Sale Price | Title Company |
|---|---|---|---|
| Soca Development Llc | $420,000 | Cambridge Land Transfer | |
| Soca Development Llc | $420,000 | Cambridge Land Transfer | |
| Pietrzak Edward | -- | None Available | |
| Pietrzak Edward | -- | None Available | |
| Pietrzak Edward | $63,333 | None Available | |
| Pietrzak Edward | -- | -- |
Source: Public Records
Tax History Compared to Growth
Tax History
| Year | Tax Paid | Tax Assessment Tax Assessment Total Assessment is a certain percentage of the fair market value that is determined by local assessors to be the total taxable value of land and additions on the property. | Land | Improvement |
|---|---|---|---|---|
| 2025 | $8,417 | $119,700 | $50,000 | $69,700 |
| 2024 | $8,233 | $119,700 | $50,000 | $69,700 |
| 2023 | $8,233 | $119,700 | $50,000 | $69,700 |
| 2022 | $8,276 | $119,700 | $50,000 | $69,700 |
| 2021 | $8,318 | $119,700 | $50,000 | $69,700 |
| 2020 | $8,274 | $119,700 | $50,000 | $69,700 |
| 2019 | $8,246 | $119,700 | $50,000 | $69,700 |
| 2018 | $8,244 | $119,700 | $50,000 | $69,700 |
| 2017 | $8,065 | $119,700 | $50,000 | $69,700 |
| 2016 | $7,812 | $119,700 | $50,000 | $69,700 |
| 2015 | $7,264 | $119,700 | $50,000 | $69,700 |
| 2014 | $7,118 | $119,700 | $50,000 | $69,700 |
Source: Public Records
Map
Nearby Homes