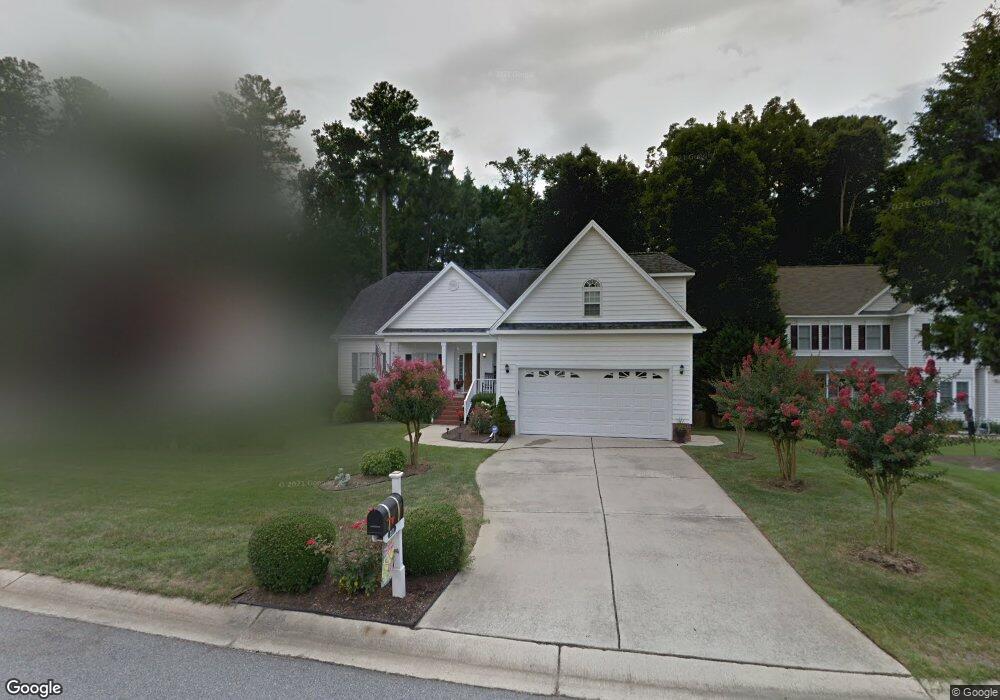
217 Highland Springs Ln Holly Springs, NC 27540
Estimated Value: $523,000 - $567,000
4
Beds
3
Baths
2,228
Sq Ft
$245/Sq Ft
Est. Value
About This Home
This home is located at 217 Highland Springs Ln, Holly Springs, NC 27540 and is currently estimated at $546,450, approximately $245 per square foot. 217 Highland Springs Ln is a home located in Wake County with nearby schools including Holly Grove Elementary School, Holly Grove Middle School, and Holly Springs High School.
Ownership History
Date
Name
Owned For
Owner Type
Purchase Details
Closed on
Jul 16, 2020
Sold by
Spangler Sean and Spangler Judy
Bought by
Spangler Sean and Putnam Kelly
Current Estimated Value
Purchase Details
Closed on
Mar 26, 2020
Sold by
Falchi Benjamin and Falchi Rose Marie
Bought by
Spangler Sean and Spangler Judy
Home Financials for this Owner
Home Financials are based on the most recent Mortgage that was taken out on this home.
Original Mortgage
$338,751
Interest Rate
3.62%
Mortgage Type
FHA
Purchase Details
Closed on
Oct 9, 1998
Sold by
Heavenly Homes Kevin R Schwartz Inc
Bought by
Falchi Benjamin and Falchi Rose Marie
Home Financials for this Owner
Home Financials are based on the most recent Mortgage that was taken out on this home.
Original Mortgage
$85,000
Interest Rate
6.95%
Create a Home Valuation Report for This Property
The Home Valuation Report is an in-depth analysis detailing your home's value as well as a comparison with similar homes in the area
Home Values in the Area
Average Home Value in this Area
Purchase History
| Date | Buyer | Sale Price | Title Company |
|---|---|---|---|
| Spangler Sean | -- | None Available | |
| Spangler Sean | -- | None Listed On Document | |
| Spangler Sean | $345,000 | None Available | |
| Spangler Sean | $345,000 | None Listed On Document | |
| Falchi Benjamin | $185,000 | -- |
Source: Public Records
Mortgage History
| Date | Status | Borrower | Loan Amount |
|---|---|---|---|
| Previous Owner | Spangler Sean | $338,751 | |
| Previous Owner | Falchi Benjamin | $85,000 |
Source: Public Records
Tax History Compared to Growth
Tax History
| Year | Tax Paid | Tax Assessment Tax Assessment Total Assessment is a certain percentage of the fair market value that is determined by local assessors to be the total taxable value of land and additions on the property. | Land | Improvement |
|---|---|---|---|---|
| 2025 | $4,236 | $489,834 | $115,000 | $374,834 |
| 2024 | $4,218 | $489,834 | $115,000 | $374,834 |
| 2023 | $3,661 | $337,574 | $52,000 | $285,574 |
| 2022 | $3,530 | $337,163 | $52,000 | $285,163 |
| 2021 | $3,346 | $330,368 | $52,000 | $278,368 |
| 2020 | $3,219 | $313,165 | $52,000 | $261,165 |
| 2019 | $3,252 | $268,635 | $52,000 | $216,635 |
| 2018 | $2,940 | $268,635 | $52,000 | $216,635 |
| 2017 | $2,834 | $268,635 | $52,000 | $216,635 |
| 2016 | $2,795 | $268,635 | $52,000 | $216,635 |
| 2015 | $2,835 | $268,266 | $52,000 | $216,266 |
| 2014 | $2,738 | $268,266 | $52,000 | $216,266 |
Source: Public Records
Map
Nearby Homes
- 300 Shorehouse Way
- 101 Covenant Rock Ln
- 1712 Avent Ferry Rd
- 100 Oakmoss Trail
- 417 Shorehouse Way
- 0 Old Airport Rd
- 208 Autumn Glen Ln
- 100 Avent Pines Ln
- 233 Hickory Glen Ln
- 161 Summit Oaks Ln
- 341 Covenant Rock Ln
- 933 Hollymont Dr
- 116 Cline Falls Dr
- 213 Holly Moor Ln
- 304 Magnolia Meadow Way
- 512 Cline Falls Dr
- 305 Martingale Dr
- 505 Pyracantha Dr
- 120 Martingale Dr
- 100 Sire Ct
- 213 Highland Springs Ln
- 221 Highland Springs Ln
- 209 Highland Springs Ln
- 225 Highland Springs Ln
- 204 Highland Springs Ln
- 216 Highland Springs Ln
- 200 Highland Springs Ln
- 208 Highland Springs Ln
- 312 Holly Branch Dr
- 205 Highland Springs Ln
- 316 Holly Branch Dr
- 212 Highland Springs Ln
- 308 Holly Branch Dr
- 304 Holly Branch Dr
- 320 Holly Branch Dr
- 300 Holly Branch Dr
- 201 Highland Springs Ln
- 204 Valley Oak Ct
- 105 Hickory Glen Ln
- 101 Hickory Glen Ln