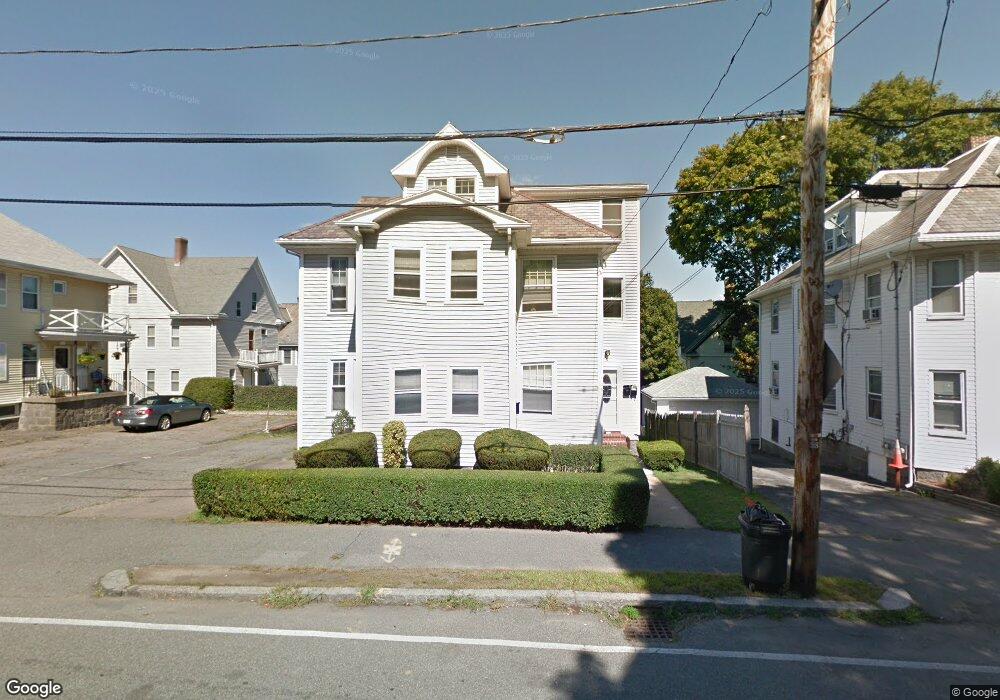
217 Kendrick Ave Unit 3 Quincy, MA 02169
South Quincy NeighborhoodEstimated Value: $901,279 - $1,203,000
1
Bed
1
Bath
600
Sq Ft
$1,716/Sq Ft
Est. Value
About This Home
This home is located at 217 Kendrick Ave Unit 3, Quincy, MA 02169 and is currently estimated at $1,029,820, approximately $1,716 per square foot. 217 Kendrick Ave Unit 3 is a home located in Norfolk County with nearby schools including Lincoln-Hancock Community School, South West Middle School, and Quincy High School.
Ownership History
Date
Name
Owned For
Owner Type
Purchase Details
Closed on
May 15, 1990
Sold by
Niosi Stephen A
Bought by
Febo Gabrielle
Current Estimated Value
Home Financials for this Owner
Home Financials are based on the most recent Mortgage that was taken out on this home.
Original Mortgage
$70,000
Interest Rate
10.15%
Mortgage Type
Purchase Money Mortgage
Create a Home Valuation Report for This Property
The Home Valuation Report is an in-depth analysis detailing your home's value as well as a comparison with similar homes in the area
Home Values in the Area
Average Home Value in this Area
Purchase History
| Date | Buyer | Sale Price | Title Company |
|---|---|---|---|
| Febo Gabrielle | $215,000 | -- |
Source: Public Records
Mortgage History
| Date | Status | Borrower | Loan Amount |
|---|---|---|---|
| Closed | Febo Gabrielle | $85,000 | |
| Closed | Febo Gabrielle | $70,000 | |
| Previous Owner | Febo Gabrielle | $175,000 |
Source: Public Records
Tax History Compared to Growth
Tax History
| Year | Tax Paid | Tax Assessment Tax Assessment Total Assessment is a certain percentage of the fair market value that is determined by local assessors to be the total taxable value of land and additions on the property. | Land | Improvement |
|---|---|---|---|---|
| 2025 | $11,867 | $1,029,200 | $275,200 | $754,000 |
| 2024 | $11,295 | $1,002,200 | $262,000 | $740,200 |
| 2023 | $10,333 | $928,400 | $238,200 | $690,200 |
| 2022 | $10,084 | $841,700 | $198,500 | $643,200 |
| 2021 | $10,043 | $827,300 | $198,500 | $628,800 |
| 2020 | $9,775 | $786,400 | $198,500 | $587,900 |
| 2019 | $9,676 | $771,000 | $187,300 | $583,700 |
| 2018 | $8,237 | $617,500 | $173,400 | $444,100 |
| 2017 | $8,370 | $590,700 | $165,200 | $425,500 |
| 2016 | $7,207 | $501,900 | $143,600 | $358,300 |
| 2015 | $7,180 | $491,800 | $143,600 | $348,200 |
| 2014 | $6,541 | $440,200 | $143,600 | $296,600 |
Source: Public Records
Map
Nearby Homes
- 177 Franklin St
- 166 Phipps St
- 86 Alton Rd
- 192 Federal Ave Unit B
- 50 N Payne St Unit 1
- 50 N Payne St Unit 3
- 50 N Payne St Unit 4
- 8 Jackson St Unit B2
- 48 Conrad St
- 9 Independence Ave Unit 307
- 118 Brook Rd Unit 2
- 106 Home Park Rd
- 94 Brook Rd Unit 3
- 51 Brook Rd
- 347 Centre St
- 21 Totman St Unit 202
- 21 Totman St Unit 309
- 21 Totman St Unit Model-1
- 21 Totman St Unit 209
- 21 Totman St Unit 203
- 217 Kendrick Ave
- 219 Kendrick Ave
- 213 Kendrick Ave
- 213 Kendrick Ave Unit 2
- 215 Kendrick Ave Unit 1
- 213 Kendrick Ave Unit A
- 213 Kendrick Ave Unit 3
- 215 Kendrick Ave
- 213 Kendrick Ave Unit 1
- 222 Franklin St
- 226 Franklin St Unit 226
- 224 Franklin St
- 40 Richie Rd
- 40 Richie Rd Unit 40
- 38 Richie Rd
- 36 Richie Rd
- 36 Richie Rd Unit 3
- 36 Richie Rd Unit 36
- 218 Franklin St
- 214 Franklin St