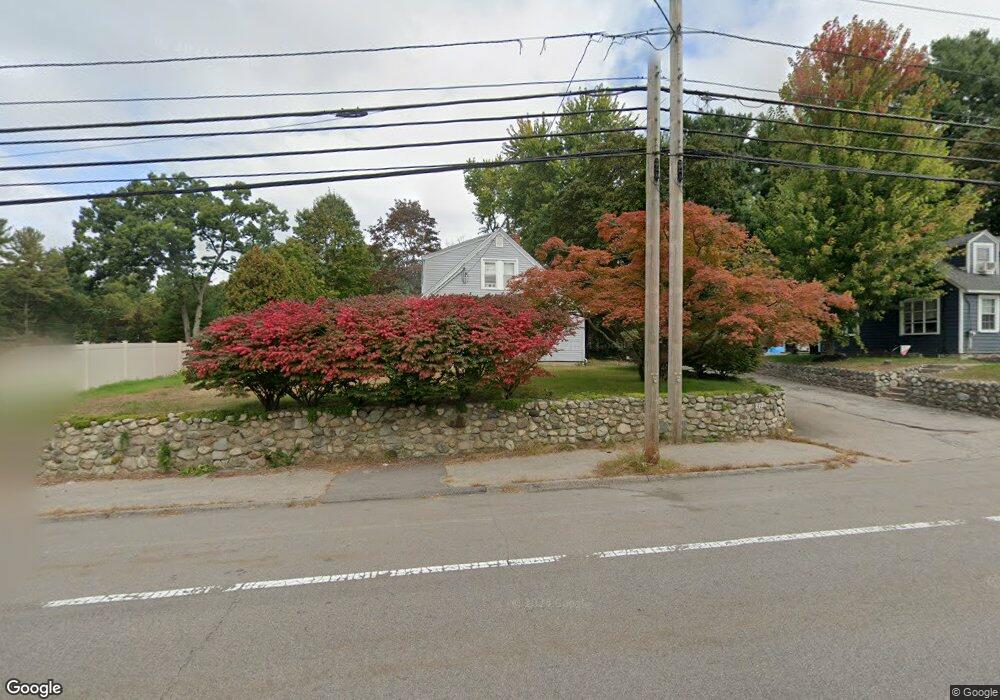
217 Main St Foxboro, MA 02035
Estimated Value: $535,000 - $734,000
3
Beds
2
Baths
1,862
Sq Ft
$335/Sq Ft
Est. Value
About This Home
This home is located at 217 Main St, Foxboro, MA 02035 and is currently estimated at $623,464, approximately $334 per square foot. 217 Main St is a home located in Norfolk County with nearby schools including Foxborough High School, Foxborough Regional Charter School, and The Sage School.
Ownership History
Date
Name
Owned For
Owner Type
Purchase Details
Closed on
Nov 13, 2020
Sold by
Brodeur Margaret A
Bought by
Brodeur Adam and Spencer Taylor
Current Estimated Value
Home Financials for this Owner
Home Financials are based on the most recent Mortgage that was taken out on this home.
Original Mortgage
$310,200
Outstanding Balance
$274,771
Interest Rate
2.8%
Mortgage Type
New Conventional
Estimated Equity
$348,693
Purchase Details
Closed on
Feb 11, 2005
Sold by
Walsh Margaret E and Walsh Patrick K
Bought by
Brodeur Margaret A and Walsh Margaret E
Purchase Details
Closed on
May 28, 1969
Bought by
Brodeur Margaret A
Create a Home Valuation Report for This Property
The Home Valuation Report is an in-depth analysis detailing your home's value as well as a comparison with similar homes in the area
Home Values in the Area
Average Home Value in this Area
Purchase History
| Date | Buyer | Sale Price | Title Company |
|---|---|---|---|
| Brodeur Adam | $420,000 | None Available | |
| Brodeur Margaret A | -- | -- | |
| Brodeur Margaret A | -- | -- |
Source: Public Records
Mortgage History
| Date | Status | Borrower | Loan Amount |
|---|---|---|---|
| Open | Brodeur Adam | $310,200 | |
| Previous Owner | Brodeur Margaret A | $160,000 | |
| Previous Owner | Brodeur Margaret A | $150,000 |
Source: Public Records
Tax History
| Year | Tax Paid | Tax Assessment Tax Assessment Total Assessment is a certain percentage of the fair market value that is determined by local assessors to be the total taxable value of land and additions on the property. | Land | Improvement |
|---|---|---|---|---|
| 2025 | $5,932 | $448,700 | $194,200 | $254,500 |
| 2024 | $5,898 | $436,600 | $209,300 | $227,300 |
| 2023 | $5,738 | $403,800 | $199,300 | $204,500 |
| 2022 | $5,454 | $375,600 | $178,700 | $196,900 |
| 2021 | $5,247 | $356,000 | $169,800 | $186,200 |
| 2020 | $5,076 | $348,400 | $169,800 | $178,600 |
| 2019 | $4,949 | $336,700 | $170,200 | $166,500 |
| 2018 | $4,884 | $335,200 | $161,700 | $173,500 |
| 2017 | $4,712 | $313,300 | $159,100 | $154,200 |
| 2016 | $4,671 | $315,200 | $153,000 | $162,200 |
| 2015 | $4,195 | $276,200 | $114,000 | $162,200 |
| 2014 | $4,140 | $276,200 | $114,000 | $162,200 |
Source: Public Records
Map
Nearby Homes
Your Personal Tour Guide
Ask me questions while you tour the home.