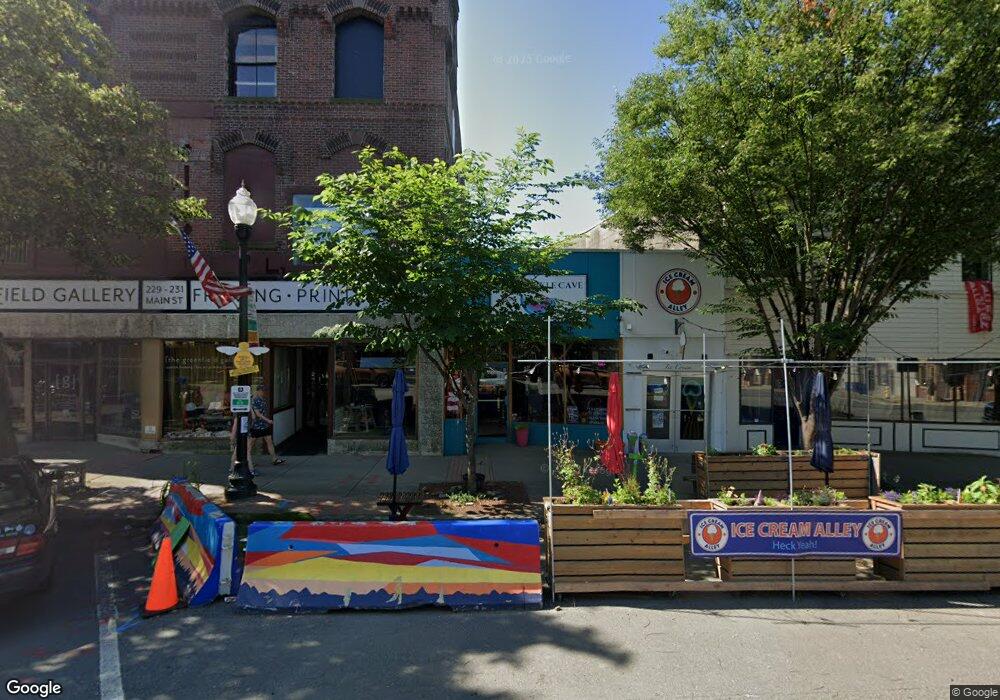
217 Main St Greenfield, MA 01301
Estimated Value: $282,904
3
Beds
3
Baths
4,678
Sq Ft
$60/Sq Ft
Est. Value
About This Home
This home is located at 217 Main St, Greenfield, MA 01301 and is currently estimated at $282,904, approximately $60 per square foot. 217 Main St is a home located in Franklin County with nearby schools including Greenfield Center School and The Bement School.
Ownership History
Date
Name
Owned For
Owner Type
Purchase Details
Closed on
Jun 1, 2021
Sold by
Singley Chris E Est and Royer
Bought by
Chapman St Properties Llc
Current Estimated Value
Home Financials for this Owner
Home Financials are based on the most recent Mortgage that was taken out on this home.
Original Mortgage
$172,000
Outstanding Balance
$155,295
Interest Rate
3%
Mortgage Type
Commercial
Estimated Equity
$127,609
Purchase Details
Closed on
Aug 17, 1999
Sold by
Bednar Susan A
Bought by
Singley Chris E
Home Financials for this Owner
Home Financials are based on the most recent Mortgage that was taken out on this home.
Original Mortgage
$34,500
Interest Rate
7.65%
Mortgage Type
Commercial
Create a Home Valuation Report for This Property
The Home Valuation Report is an in-depth analysis detailing your home's value as well as a comparison with similar homes in the area
Home Values in the Area
Average Home Value in this Area
Purchase History
| Date | Buyer | Sale Price | Title Company |
|---|---|---|---|
| Chapman St Properties Llc | $215,000 | None Available | |
| Chapman St Properties Llc | $215,000 | None Available | |
| Singley Chris E | $34,500 | -- | |
| Singley Chris E | $34,500 | -- |
Source: Public Records
Mortgage History
| Date | Status | Borrower | Loan Amount |
|---|---|---|---|
| Open | Chapman St Properties Llc | $172,000 | |
| Closed | Chapman St Properties Llc | $172,000 | |
| Previous Owner | Singley Chris E | $34,500 |
Source: Public Records
Tax History
| Year | Tax Paid | Tax Assessment Tax Assessment Total Assessment is a certain percentage of the fair market value that is determined by local assessors to be the total taxable value of land and additions on the property. | Land | Improvement |
|---|---|---|---|---|
| 2025 | $5,035 | $257,400 | $100,700 | $156,700 |
| 2024 | $5,151 | $252,600 | $95,900 | $156,700 |
| 2023 | $4,555 | $231,800 | $87,100 | $144,700 |
| 2022 | $5,011 | $224,500 | $82,900 | $141,600 |
| 2021 | $5,359 | $230,800 | $87,800 | $143,000 |
| 2020 | $5,187 | $226,200 | $87,800 | $138,400 |
| 2019 | $5,058 | $226,200 | $87,800 | $138,400 |
| 2018 | $4,701 | $209,600 | $80,500 | $129,100 |
| 2017 | $4,368 | $201,000 | $80,500 | $120,500 |
| 2016 | $4,338 | $198,900 | $80,500 | $118,400 |
| 2015 | $4,536 | $201,500 | $78,100 | $123,400 |
| 2014 | $4,137 | $201,500 | $78,100 | $123,400 |
Source: Public Records
Map
Nearby Homes
Your Personal Tour Guide
Ask me questions while you tour the home.