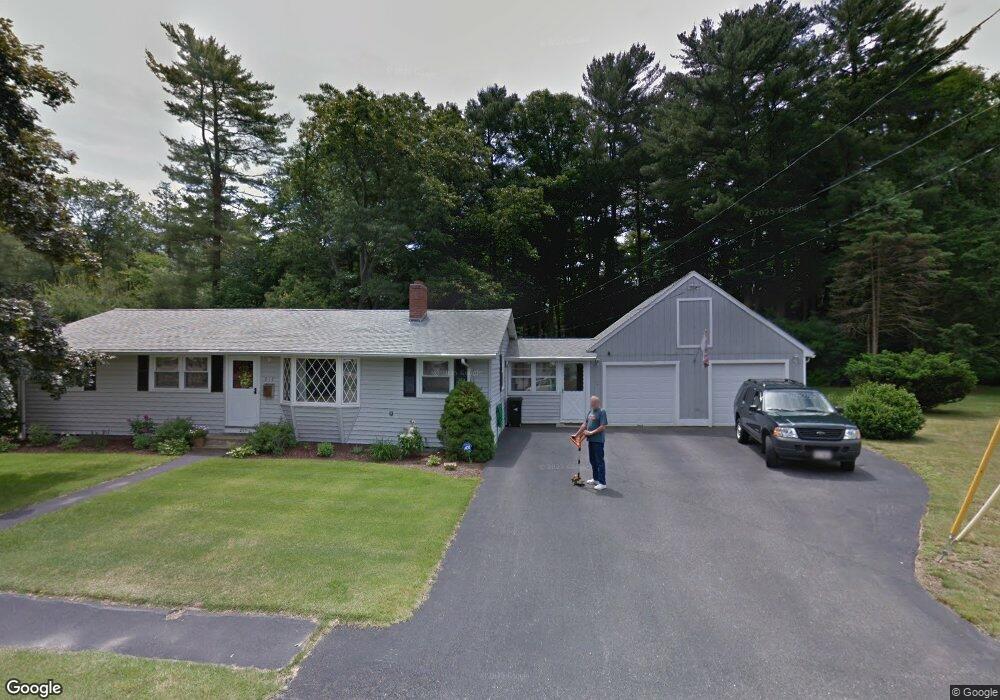
217 Marks St Rockland, MA 02370
Estimated Value: $501,000 - $549,000
2
Beds
2
Baths
1,152
Sq Ft
$461/Sq Ft
Est. Value
About This Home
This home is located at 217 Marks St, Rockland, MA 02370 and is currently estimated at $531,319, approximately $461 per square foot. 217 Marks St is a home located in Plymouth County with nearby schools including Rockland Senior High School, Calvary Chapel Academy, and Holy Family Elementary School.
Ownership History
Date
Name
Owned For
Owner Type
Purchase Details
Closed on
May 8, 2007
Sold by
Angeley Mrk E
Bought by
Farrar Lloyd R and Farrar Gayke M
Current Estimated Value
Home Financials for this Owner
Home Financials are based on the most recent Mortgage that was taken out on this home.
Original Mortgage
$293,395
Outstanding Balance
$179,047
Interest Rate
6.23%
Mortgage Type
Purchase Money Mortgage
Estimated Equity
$352,272
Purchase Details
Closed on
Aug 17, 2001
Sold by
Angeley Donald Est
Bought by
Angeley Mark E
Home Financials for this Owner
Home Financials are based on the most recent Mortgage that was taken out on this home.
Original Mortgage
$154,500
Interest Rate
7.16%
Mortgage Type
Purchase Money Mortgage
Create a Home Valuation Report for This Property
The Home Valuation Report is an in-depth analysis detailing your home's value as well as a comparison with similar homes in the area
Home Values in the Area
Average Home Value in this Area
Purchase History
| Date | Buyer | Sale Price | Title Company |
|---|---|---|---|
| Farrar Lloyd R | $298,000 | -- | |
| Angeley Mark E | $205,000 | -- |
Source: Public Records
Mortgage History
| Date | Status | Borrower | Loan Amount |
|---|---|---|---|
| Open | Angeley Mark E | $293,395 | |
| Previous Owner | Angeley Mark E | $50,000 | |
| Previous Owner | Angeley Mark E | $200,000 | |
| Previous Owner | Angeley Mark E | $154,500 |
Source: Public Records
Tax History Compared to Growth
Tax History
| Year | Tax Paid | Tax Assessment Tax Assessment Total Assessment is a certain percentage of the fair market value that is determined by local assessors to be the total taxable value of land and additions on the property. | Land | Improvement |
|---|---|---|---|---|
| 2025 | $6,157 | $450,400 | $236,900 | $213,500 |
| 2024 | $5,977 | $425,100 | $223,500 | $201,600 |
| 2023 | $5,937 | $390,100 | $205,000 | $185,100 |
| 2022 | $5,685 | $339,400 | $178,300 | $161,100 |
| 2021 | $5,020 | $303,200 | $162,100 | $141,100 |
| 2020 | $5,054 | $288,800 | $154,400 | $134,400 |
| 2019 | $4,932 | $275,200 | $147,000 | $128,200 |
| 2018 | $4,800 | $251,900 | $147,000 | $104,900 |
| 2017 | $4,480 | $242,400 | $147,000 | $95,400 |
| 2016 | $4,312 | $233,200 | $141,400 | $91,800 |
| 2015 | $4,103 | $215,600 | $132,100 | $83,500 |
| 2014 | $3,965 | $216,200 | $129,600 | $86,600 |
Source: Public Records
Map
Nearby Homes
- 4 Phillips St
- 5 Corn Mill Way
- 1 Corn Mill Way
- 354 Webster St
- 49 Liberty St
- 21 Archer Rd
- 440 Market St
- 3 Kasey Ln Unit 3
- 94-96 Crescent St
- 206-208 Hingham St
- 63 Webster St
- 45-47 Park St
- 86 Damon Rd
- 44 Albion St
- 1015 Webster St
- 23 Payson Ave
- 983 Webster St
- 149 Concord St
- 5 Hobart Ln Unit 5
- 83 Summit St