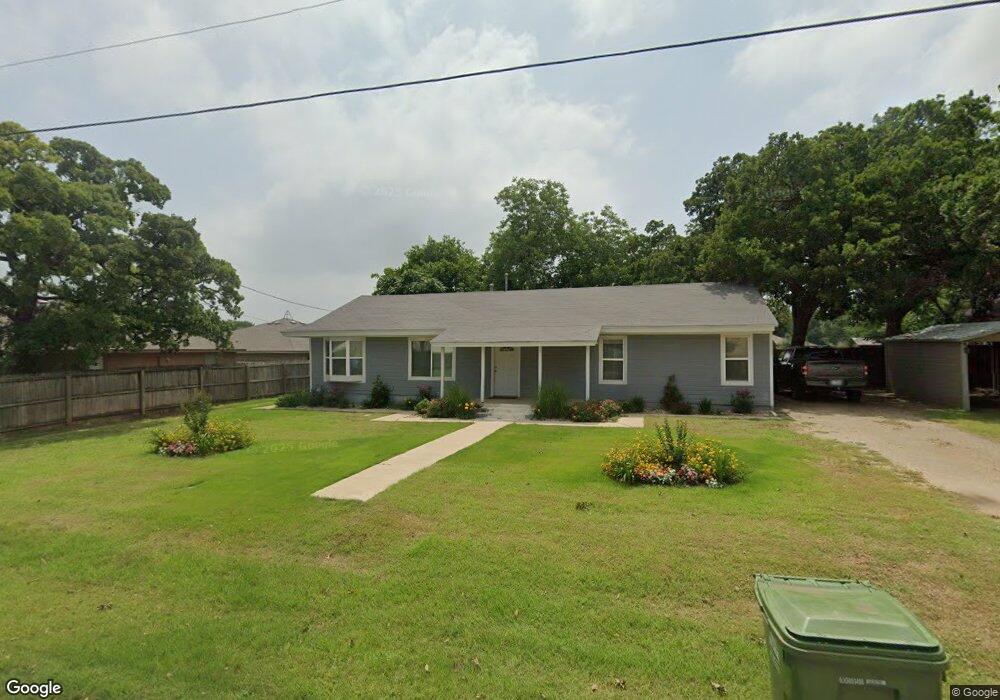
217 N Ash St Springtown, TX 76082
Estimated Value: $249,384 - $284,000
3
Beds
2
Baths
1,400
Sq Ft
$194/Sq Ft
Est. Value
About This Home
This home is located at 217 N Ash St, Springtown, TX 76082 and is currently estimated at $272,096, approximately $194 per square foot. 217 N Ash St is a home located in Parker County with nearby schools including Goshen Creek Elementary School, Springtown Intermediate School, and Springtown Middle School.
Ownership History
Date
Name
Owned For
Owner Type
Purchase Details
Closed on
Sep 8, 2016
Sold by
Kroening Justin K and Kroening Mercedes
Bought by
Hopf David
Current Estimated Value
Home Financials for this Owner
Home Financials are based on the most recent Mortgage that was taken out on this home.
Original Mortgage
$77,330
Outstanding Balance
$61,867
Interest Rate
3.48%
Mortgage Type
FHA
Estimated Equity
$210,229
Purchase Details
Closed on
Aug 17, 2006
Sold by
Cotten Dennis W and Cotten Alene
Bought by
Hopf David
Purchase Details
Closed on
May 1, 2006
Sold by
Cotten Dennis W and Cotten Dennis Waylen
Bought by
Kroening Justin K
Home Financials for this Owner
Home Financials are based on the most recent Mortgage that was taken out on this home.
Original Mortgage
$55,454
Interest Rate
6.36%
Mortgage Type
FHA
Purchase Details
Closed on
Jul 20, 1993
Bought by
Hopf David
Purchase Details
Closed on
Jan 1, 1901
Bought by
Hopf David
Create a Home Valuation Report for This Property
The Home Valuation Report is an in-depth analysis detailing your home's value as well as a comparison with similar homes in the area
Home Values in the Area
Average Home Value in this Area
Purchase History
| Date | Buyer | Sale Price | Title Company |
|---|---|---|---|
| Hopf David | -- | Fnt | |
| Hopf David | -- | -- | |
| Kroening Justin K | -- | Fnt | |
| Hopf David | -- | -- | |
| Hopf David | -- | -- |
Source: Public Records
Mortgage History
| Date | Status | Borrower | Loan Amount |
|---|---|---|---|
| Open | Hopf David | $77,330 | |
| Previous Owner | Kroening Justin K | $55,454 |
Source: Public Records
Tax History
| Year | Tax Paid | Tax Assessment Tax Assessment Total Assessment is a certain percentage of the fair market value that is determined by local assessors to be the total taxable value of land and additions on the property. | Land | Improvement |
|---|---|---|---|---|
| 2025 | $2,025 | $159,454 | -- | -- |
| 2024 | $2,025 | $144,958 | -- | -- |
| 2023 | $2,025 | $131,780 | $0 | $0 |
| 2022 | $2,721 | $165,290 | $45,000 | $120,290 |
| 2021 | $2,724 | $165,290 | $45,000 | $120,290 |
| 2020 | $2,467 | $109,080 | $25,000 | $84,080 |
| 2019 | $2,395 | $109,080 | $25,000 | $84,080 |
Source: Public Records
Map
Nearby Homes
- 227 Walnut Bend Rd
- 108 N Ash St
- 1037 Gonzollas Rd
- 1073 Gonzollas Rd
- 1077 Gonzollas Rd
- 1886 Jay Bird Ln
- 1012 Morgan Ct
- 1009 Morgan Ct
- 325 Skeen Peak
- 1017 Morgan Ct
- 1004 Morgan Ct
- 105 Cattleman Dr
- 209 E 1st St
- 312 N Avenue B
- 309 N Cedar St
- 208 Optimist Rd
- TBD W 5th St
- 1113 Gonzollas Rd
- 314 W 5th St
- TBD S Ash St
- 225 N Ash St
- 202 Walnut Bend Rd
- 200 Walnut Bend Rd
- 206 Walnut Bend Rd
- 208 Walnut Bend Rd
- 212 Walnut Bend Rd
- 214 Walnut Bend Rd
- 229 N Ash St
- 212 N Ash St
- 205 W 3rd St
- 205 N Ash St
- 215 Walnut Bend Rd
- 224 Walnut Bend Rd
- 213 W 3rd St
- 219 Walnut Bend Rd
- 112 W 2nd St
- 226 Walnut Bend Rd
- 0 W 3rd St Unit 9624417
- 202 W 3rd St
- 230 Walnut Bend Rd
Your Personal Tour Guide
Ask me questions while you tour the home.