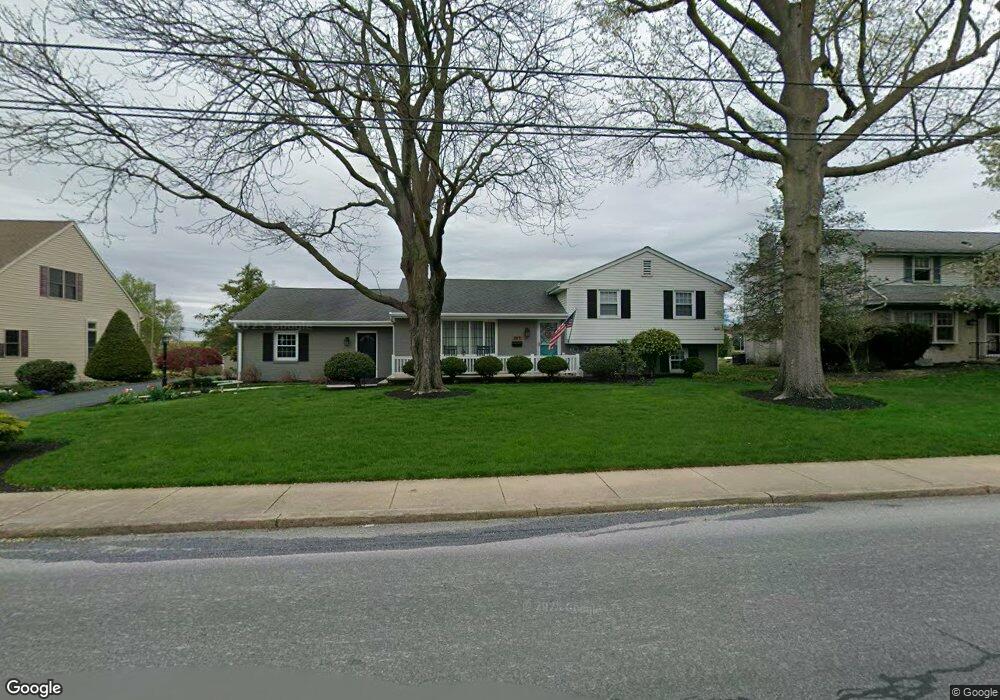
217 N Kinzer Ave New Holland, PA 17557
Estimated Value: $388,000 - $432,000
3
Beds
2
Baths
1,392
Sq Ft
$295/Sq Ft
Est. Value
About This Home
This home is located at 217 N Kinzer Ave, New Holland, PA 17557 and is currently estimated at $410,572, approximately $294 per square foot. 217 N Kinzer Ave is a home located in Lancaster County with nearby schools including Garden Spot Middle School, Garden Spot Senior High School, and Crossroads Mennonite School.
Ownership History
Date
Name
Owned For
Owner Type
Purchase Details
Closed on
Jul 12, 2017
Sold by
Mellinger Duane E and Mellinger Rhonda S
Bought by
Mellinger Duane E
Current Estimated Value
Home Financials for this Owner
Home Financials are based on the most recent Mortgage that was taken out on this home.
Original Mortgage
$182,400
Outstanding Balance
$151,751
Interest Rate
3.94%
Mortgage Type
New Conventional
Estimated Equity
$258,821
Purchase Details
Closed on
Mar 24, 2006
Sold by
Constantine Daniel and Constantine Ann M
Bought by
Mellinger Duane E and Mellinger Rhonda S
Home Financials for this Owner
Home Financials are based on the most recent Mortgage that was taken out on this home.
Original Mortgage
$138,750
Interest Rate
6.28%
Mortgage Type
Purchase Money Mortgage
Create a Home Valuation Report for This Property
The Home Valuation Report is an in-depth analysis detailing your home's value as well as a comparison with similar homes in the area
Home Values in the Area
Average Home Value in this Area
Purchase History
| Date | Buyer | Sale Price | Title Company |
|---|---|---|---|
| Mellinger Duane E | -- | None Available | |
| Mellinger Duane E | $257,000 | First American Title Ins Co |
Source: Public Records
Mortgage History
| Date | Status | Borrower | Loan Amount |
|---|---|---|---|
| Open | Mellinger Duane E | $182,400 | |
| Closed | Mellinger Duane E | $138,750 |
Source: Public Records
Tax History Compared to Growth
Tax History
| Year | Tax Paid | Tax Assessment Tax Assessment Total Assessment is a certain percentage of the fair market value that is determined by local assessors to be the total taxable value of land and additions on the property. | Land | Improvement |
|---|---|---|---|---|
| 2025 | $4,181 | $209,500 | $72,100 | $137,400 |
| 2024 | $4,181 | $209,500 | $72,100 | $137,400 |
| 2023 | $4,023 | $209,500 | $72,100 | $137,400 |
| 2022 | $3,983 | $209,500 | $72,100 | $137,400 |
| 2021 | $3,820 | $209,500 | $72,100 | $137,400 |
| 2020 | $3,820 | $209,500 | $72,100 | $137,400 |
| 2019 | $3,781 | $209,500 | $72,100 | $137,400 |
| 2018 | $4,409 | $209,500 | $72,100 | $137,400 |
| 2016 | $3,936 | $177,500 | $50,500 | $127,000 |
| 2015 | $1,266 | $177,500 | $50,500 | $127,000 |
| 2014 | $2,494 | $177,500 | $50,500 | $127,000 |
Source: Public Records
Map
Nearby Homes
- 20 N Kinzer Ave
- 148 E Broad St
- 391 E Jackson St
- 385 Valley View Dr
- 144 W Conestoga St
- 406 Brimmer Ave
- 227 Locust St
- 220 Sycamore Ln
- 41 Ashlea Village
- 80 Diller Ave Unit 9
- 529 Ranck Rd Unit 1
- 529 Ranck Rd Unit 2
- 529 Ranck Rd Unit 3
- 529 Ranck Rd Unit 4
- 529 Ranck Rd Unit 5
- 529 Ranck Rd Unit 9
- 529 Ranck Rd Unit 6
- 529 Ranck Rd Unit 8
- 529 Ranck Rd Unit 10
- 13 Amber Cir
- 213 N Kinzer Ave
- 221 N Kinzer Ave
- 351 E Cedar St
- 209 N Kinzer Ave
- 430 E Spruce St
- 344 E Spruce St
- LOT 7 E Spruce St Unit 7
- 347 E Cedar St
- 350 E Cedar St
- 204 Leeann Ct
- 205 N Kinzer Ave
- 340 E Spruce St
- 346 E Cedar St
- 343 E Cedar St
- 200 Leeann Ct
- 342 E Cedar St
- 336 E Spruce St
- 355 E Conestoga St
- 201 N Kinzer Ave
- 208 Leeann Ct