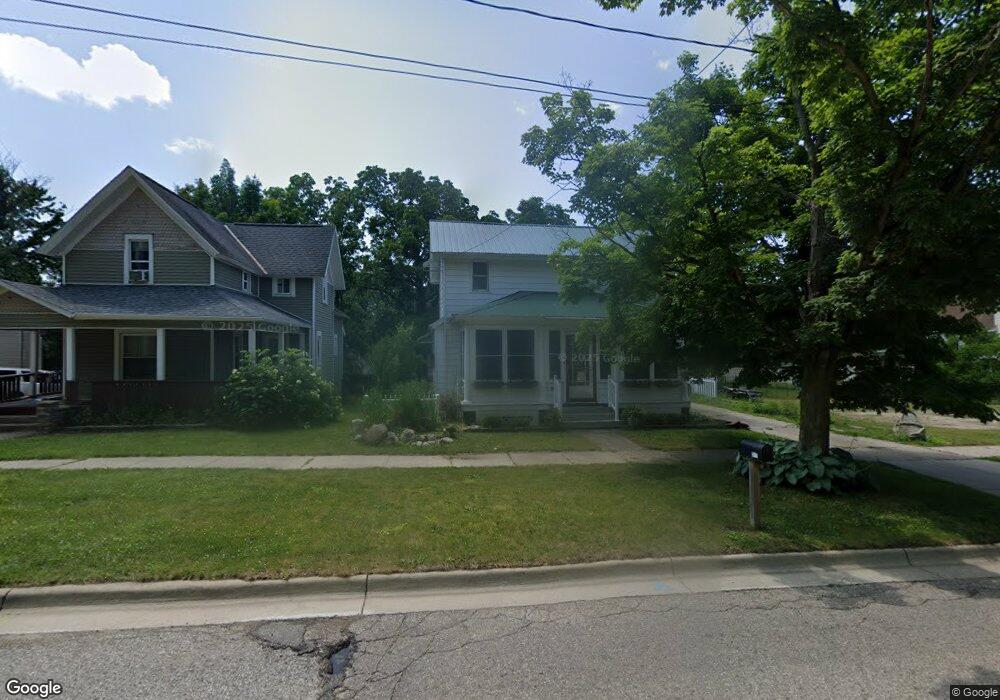
217 N Main St Allegan, MI 49010
Estimated Value: $140,000 - $199,567
3
Beds
2
Baths
1,104
Sq Ft
$162/Sq Ft
Est. Value
About This Home
This home is located at 217 N Main St, Allegan, MI 49010 and is currently estimated at $179,142, approximately $162 per square foot. 217 N Main St is a home located in Allegan County with nearby schools including North Ward Elementary School, L.E. White Middle School, and Allegan High School.
Ownership History
Date
Name
Owned For
Owner Type
Purchase Details
Closed on
Dec 22, 2020
Sold by
Wilkerson Willie Ronadl
Bought by
Wilkerson Jefferson Kyle
Current Estimated Value
Purchase Details
Closed on
Sep 28, 2011
Sold by
Federal Home Loan Mortgage Corporation
Bought by
Wilkerson Willie R and Wilkerson Doreen L
Purchase Details
Closed on
Jul 20, 2011
Sold by
Luttrell Gloria and Luttrell Gloria G
Bought by
Federal Home Loan Mortgage Corporation
Purchase Details
Closed on
Jun 16, 2011
Sold by
Luttrell Gloria G
Bought by
Federal Home Loan Mortgage Corp
Purchase Details
Closed on
Jul 1, 1990
Bought by
Luttrell
Create a Home Valuation Report for This Property
The Home Valuation Report is an in-depth analysis detailing your home's value as well as a comparison with similar homes in the area
Home Values in the Area
Average Home Value in this Area
Purchase History
| Date | Buyer | Sale Price | Title Company |
|---|---|---|---|
| Wilkerson Jefferson Kyle | -- | None Available | |
| Wilkerson Willie R | $17,900 | Attorneys Title Agency Llc | |
| Federal Home Loan Mortgage Corporation | $3,500 | Attorneys Title Agency Llc | |
| Federal Home Loan Mortgage Corp | $59,505 | None Available | |
| Luttrell | $50,000 | -- |
Source: Public Records
Tax History Compared to Growth
Tax History
| Year | Tax Paid | Tax Assessment Tax Assessment Total Assessment is a certain percentage of the fair market value that is determined by local assessors to be the total taxable value of land and additions on the property. | Land | Improvement |
|---|---|---|---|---|
| 2025 | $1,352 | $74,600 | $13,400 | $61,200 |
| 2024 | $1,230 | $72,300 | $12,900 | $59,400 |
| 2023 | $1,275 | $61,800 | $12,100 | $49,700 |
| 2022 | $1,230 | $52,300 | $10,200 | $42,100 |
| 2021 | $1,176 | $48,800 | $8,000 | $40,800 |
| 2020 | $1,159 | $40,600 | $6,700 | $33,900 |
| 2019 | $1,131 | $35,100 | $5,700 | $29,400 |
| 2018 | $1,086 | $32,100 | $5,600 | $26,500 |
| 2017 | $0 | $29,400 | $4,700 | $24,700 |
| 2016 | $0 | $24,200 | $3,900 | $20,300 |
| 2015 | -- | $24,200 | $3,900 | $20,300 |
| 2014 | -- | $25,300 | $3,900 | $21,400 |
| 2013 | $2,266 | $26,400 | $3,900 | $22,500 |
Source: Public Records
Map
Nearby Homes