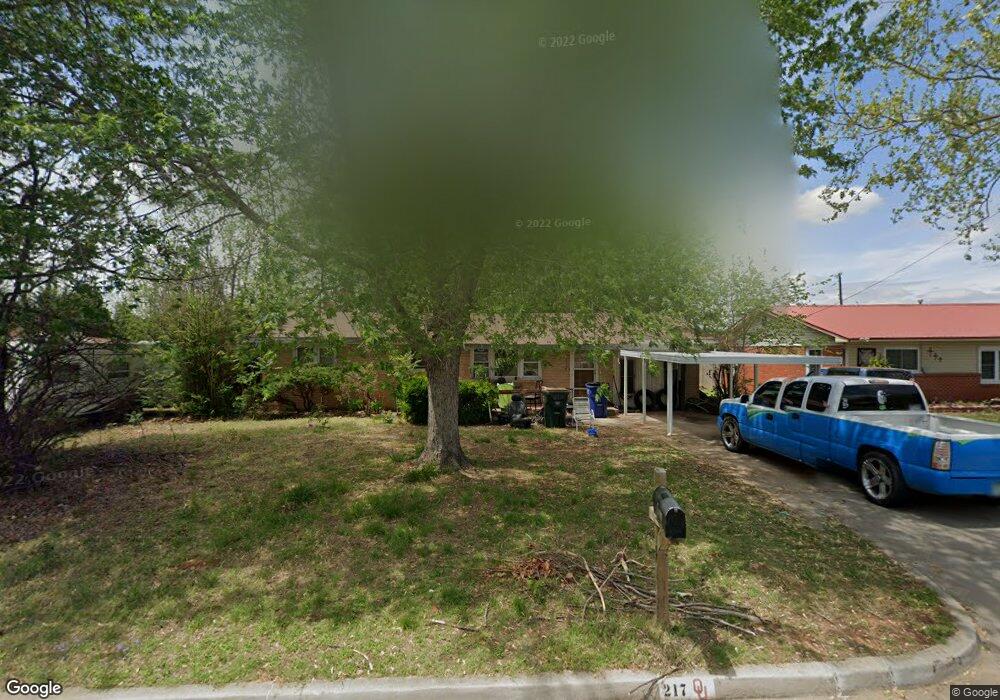
217 N N St Duncan, OK 73533
Estimated Value: $98,911 - $122,000
3
Beds
1
Bath
1,325
Sq Ft
$86/Sq Ft
Est. Value
About This Home
This home is located at 217 N N St, Duncan, OK 73533 and is currently estimated at $113,478, approximately $85 per square foot. 217 N N St is a home located in Stephens County with nearby schools including Woodrow Wilson Elementary School, Duncan Middle School, and Duncan High School.
Ownership History
Date
Name
Owned For
Owner Type
Purchase Details
Closed on
Mar 23, 2005
Sold by
Evans Robert T
Bought by
Cook Brandon M and Cook Erica
Current Estimated Value
Home Financials for this Owner
Home Financials are based on the most recent Mortgage that was taken out on this home.
Original Mortgage
$45,000
Outstanding Balance
$22,904
Interest Rate
5.67%
Mortgage Type
New Conventional
Estimated Equity
$90,574
Purchase Details
Closed on
Nov 13, 2000
Sold by
Evans Robert T and Evans Lelia
Purchase Details
Closed on
Oct 19, 2000
Sold by
Walker Archie T and Walker Rhetta
Create a Home Valuation Report for This Property
The Home Valuation Report is an in-depth analysis detailing your home's value as well as a comparison with similar homes in the area
Home Values in the Area
Average Home Value in this Area
Purchase History
| Date | Buyer | Sale Price | Title Company |
|---|---|---|---|
| Cook Brandon M | $45,000 | None Available | |
| -- | $45,000 | -- | |
| -- | $45,000 | -- |
Source: Public Records
Mortgage History
| Date | Status | Borrower | Loan Amount |
|---|---|---|---|
| Open | Cook Brandon M | $45,000 |
Source: Public Records
Tax History Compared to Growth
Tax History
| Year | Tax Paid | Tax Assessment Tax Assessment Total Assessment is a certain percentage of the fair market value that is determined by local assessors to be the total taxable value of land and additions on the property. | Land | Improvement |
|---|---|---|---|---|
| 2025 | $489 | $6,939 | $111 | $6,828 |
| 2024 | $489 | $6,737 | $111 | $6,626 |
| 2023 | $489 | $6,737 | $111 | $6,626 |
| 2022 | $455 | $6,541 | $159 | $6,382 |
| 2021 | $455 | $6,350 | $83 | $6,267 |
| 2020 | $430 | $5,985 | $83 | $5,902 |
| 2019 | $416 | $5,811 | $121 | $5,690 |
| 2018 | $413 | $5,734 | $83 | $5,651 |
| 2017 | $385 | $5,478 | $83 | $5,395 |
| 2016 | $382 | $5,498 | $495 | $5,003 |
| 2015 | $461 | $5,498 | $495 | $5,003 |
| 2014 | $461 | $5,498 | $495 | $5,003 |
Source: Public Records
Map
Nearby Homes