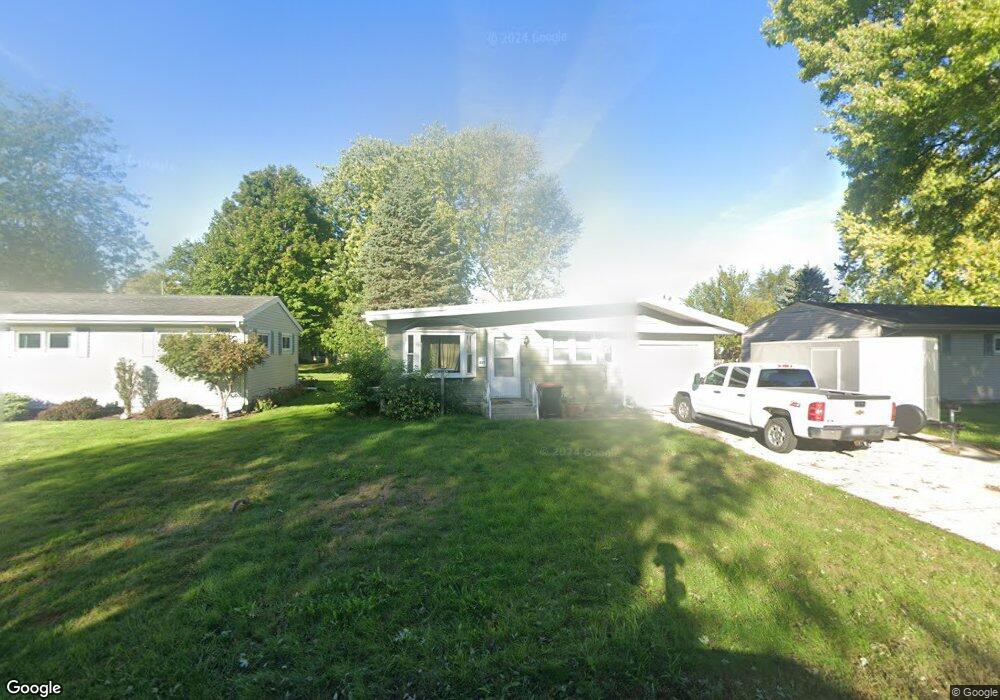
217 N Rauthland Ave Wapakoneta, OH 45895
Estimated Value: $144,000 - $187,000
3
Beds
1
Bath
988
Sq Ft
$172/Sq Ft
Est. Value
About This Home
This home is located at 217 N Rauthland Ave, Wapakoneta, OH 45895 and is currently estimated at $170,349, approximately $172 per square foot. 217 N Rauthland Ave is a home located in Auglaize County with nearby schools including Wapakoneta Elementary School, Wapakoneta High School, and Wapakoneta Middle School.
Ownership History
Date
Name
Owned For
Owner Type
Purchase Details
Closed on
Mar 29, 2014
Sold by
Wheaton Carol A and Wheaton Robin
Bought by
Wheaton Carol A and Wheaton Robin
Current Estimated Value
Home Financials for this Owner
Home Financials are based on the most recent Mortgage that was taken out on this home.
Original Mortgage
$64,075
Outstanding Balance
$19,346
Interest Rate
4.41%
Mortgage Type
VA
Estimated Equity
$151,003
Purchase Details
Closed on
Mar 2, 2000
Bought by
Orick Carol A
Purchase Details
Closed on
Nov 12, 1999
Sold by
Gabriel Shawn C
Bought by
Secretary Of Housing
Purchase Details
Closed on
Oct 18, 1996
Sold by
Branson Janice R
Bought by
Gabriel Shawn C
Purchase Details
Closed on
Feb 3, 1992
Bought by
R E Becker Builders Inc
Purchase Details
Closed on
Oct 17, 1991
Sold by
Frey Alan L
Bought by
R E Becker Builders Inc
Purchase Details
Closed on
Jul 1, 1987
Create a Home Valuation Report for This Property
The Home Valuation Report is an in-depth analysis detailing your home's value as well as a comparison with similar homes in the area
Home Values in the Area
Average Home Value in this Area
Purchase History
| Date | Buyer | Sale Price | Title Company |
|---|---|---|---|
| Wheaton Carol A | -- | Title Source Inc | |
| Orick Carol A | -- | -- | |
| Secretary Of Housing | -- | -- | |
| Gabriel Shawn C | $66,000 | -- | |
| R E Becker Builders Inc | $50,000 | -- | |
| R E Becker Builders Inc | -- | -- | |
| -- | $42,000 | -- |
Source: Public Records
Mortgage History
| Date | Status | Borrower | Loan Amount |
|---|---|---|---|
| Open | Wheaton Carol A | $64,075 |
Source: Public Records
Tax History Compared to Growth
Tax History
| Year | Tax Paid | Tax Assessment Tax Assessment Total Assessment is a certain percentage of the fair market value that is determined by local assessors to be the total taxable value of land and additions on the property. | Land | Improvement |
|---|---|---|---|---|
| 2024 | $2,016 | $41,360 | $9,160 | $32,200 |
| 2023 | $1,060 | $41,360 | $9,160 | $32,200 |
| 2022 | $839 | $31,950 | $8,310 | $23,640 |
| 2021 | $819 | $31,950 | $8,310 | $23,640 |
| 2020 | $421 | $31,942 | $8,306 | $23,636 |
| 2019 | $634 | $25,859 | $6,724 | $19,135 |
| 2018 | $951 | $25,859 | $6,724 | $19,135 |
| 2017 | $633 | $25,859 | $6,724 | $19,135 |
| 2016 | $890 | $24,364 | $6,318 | $18,046 |
| 2015 | $878 | $24,364 | $6,318 | $18,046 |
| 2014 | $907 | $24,364 | $6,318 | $18,046 |
| 2013 | $903 | $24,364 | $6,318 | $18,046 |
Source: Public Records
Map
Nearby Homes
- 215 N Rauthland Ave
- 219 N Rauthland Ave
- 221 N Rauthland Ave
- 220 Cherry Ln
- 222 Cherry Ln
- 218 Cherry Ln
- 224 Cherry Ln
- 211 S Rauthland Ave
- 211 N Rauthland Ave
- 218 N Rauthland Ave
- 220 N Rauthland Ave
- 216 Cherry Ln
- 226 Cherry Ln
- 214 N Rauthland Ave
- 222 N Rauthland Ave
- 225 N Rauthland Ave
- 228 Cherry Ln
- 224 N Rauthland Ave