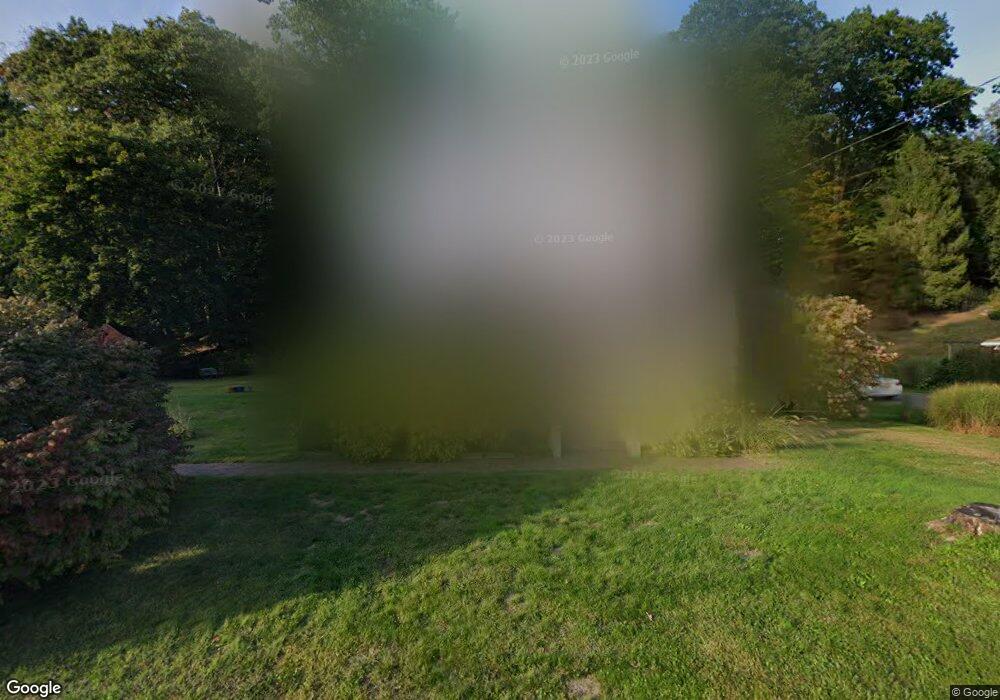
217 Oak St Great Barrington, MA 01230
Estimated Value: $363,922 - $749,000
3
Beds
1
Bath
1,100
Sq Ft
$484/Sq Ft
Est. Value
About This Home
This home is located at 217 Oak St, Great Barrington, MA 01230 and is currently estimated at $532,231, approximately $483 per square foot. 217 Oak St is a home located in Berkshire County with nearby schools including Muddy Brook Regional Elementary School, W.E.B Du Bois Regional Middle School, and Monument Mountain Regional High School.
Ownership History
Date
Name
Owned For
Owner Type
Purchase Details
Closed on
Jul 10, 1997
Sold by
Gentile Lawrence J and Gentile Margaret A
Bought by
Waldstein Arne P and Lavinio Marie A
Current Estimated Value
Purchase Details
Closed on
Oct 30, 1992
Sold by
Belingni Michael J
Bought by
Gentile Lawrence J and Gentile Margaret A
Create a Home Valuation Report for This Property
The Home Valuation Report is an in-depth analysis detailing your home's value as well as a comparison with similar homes in the area
Home Values in the Area
Average Home Value in this Area
Purchase History
| Date | Buyer | Sale Price | Title Company |
|---|---|---|---|
| Waldstein Arne P | $118,000 | -- | |
| Waldstein Arne P | $118,000 | -- | |
| Gentile Lawrence J | $110,000 | -- | |
| Gentile Lawrence J | $110,000 | -- |
Source: Public Records
Mortgage History
| Date | Status | Borrower | Loan Amount |
|---|---|---|---|
| Open | Gentile Lawrence J | $90,000 | |
| Closed | Gentile Lawrence J | $80,000 | |
| Closed | Gentile Lawrence J | $82,000 |
Source: Public Records
Tax History Compared to Growth
Tax History
| Year | Tax Paid | Tax Assessment Tax Assessment Total Assessment is a certain percentage of the fair market value that is determined by local assessors to be the total taxable value of land and additions on the property. | Land | Improvement |
|---|---|---|---|---|
| 2025 | $4,569 | $331,300 | $93,900 | $237,400 |
| 2024 | $4,167 | $300,000 | $90,500 | $209,500 |
| 2023 | $3,602 | $273,800 | $90,500 | $183,300 |
| 2022 | $3,602 | $242,400 | $82,300 | $160,100 |
| 2019 | $3,358 | $213,600 | $65,200 | $148,400 |
| 2018 | $3,156 | $210,700 | $65,200 | $145,500 |
| 2017 | $3,076 | $210,700 | $65,200 | $145,500 |
| 2016 | $3,004 | $210,200 | $61,100 | $149,100 |
| 2015 | $2,884 | $210,200 | $61,100 | $149,100 |
Source: Public Records
Map
Nearby Homes