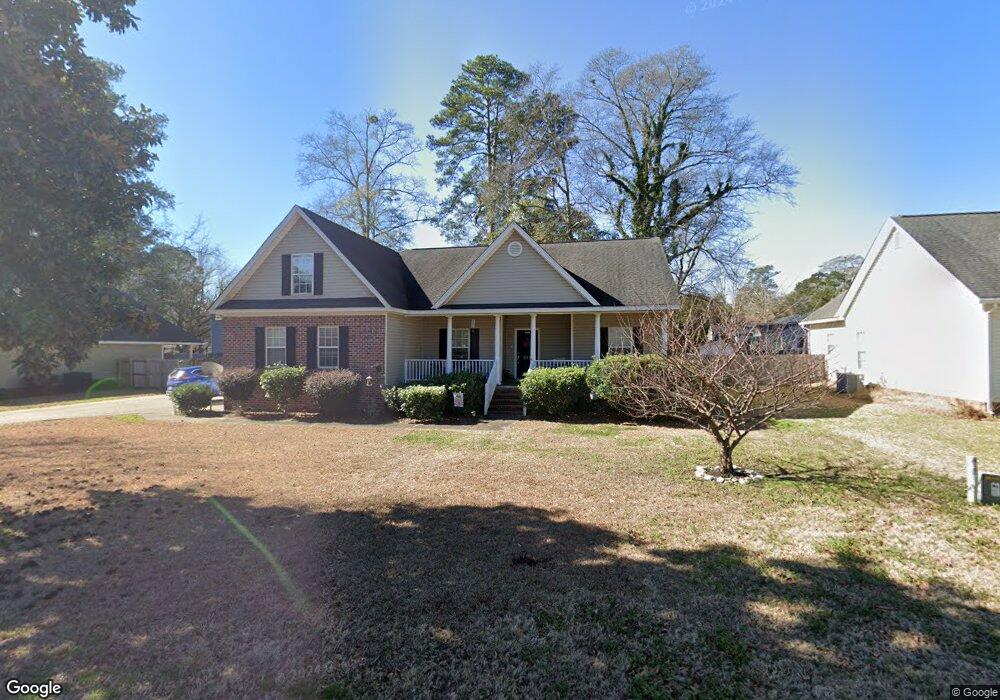
217 S Calhoun Dr Florence, SC 29501
West Haven NeighborhoodEstimated Value: $262,000 - $341,000
3
Beds
3
Baths
2,200
Sq Ft
$137/Sq Ft
Est. Value
About This Home
This home is located at 217 S Calhoun Dr, Florence, SC 29501 and is currently estimated at $302,418, approximately $137 per square foot. 217 S Calhoun Dr is a home located in Florence County with nearby schools including Royall Elementary School, John W. Moore Middle School, and Henry L. Sneed Middle School.
Ownership History
Date
Name
Owned For
Owner Type
Purchase Details
Closed on
Apr 23, 2012
Sold by
Cox Courtney A
Bought by
Hughes Leslie S and Hughes Gayle L
Current Estimated Value
Home Financials for this Owner
Home Financials are based on the most recent Mortgage that was taken out on this home.
Original Mortgage
$202,468
Outstanding Balance
$137,663
Interest Rate
3.96%
Mortgage Type
VA
Estimated Equity
$164,755
Purchase Details
Closed on
Jul 10, 2009
Sold by
Rowell Wade C
Bought by
Cox Courtney A
Purchase Details
Closed on
Dec 19, 2005
Sold by
Lexus Development Inc
Bought by
Rowell Wade C and Cox Courtney A
Home Financials for this Owner
Home Financials are based on the most recent Mortgage that was taken out on this home.
Original Mortgage
$175,000
Interest Rate
6.28%
Mortgage Type
New Conventional
Purchase Details
Closed on
Jan 16, 2004
Sold by
Sawicki William R and Sawicki Family Partnership
Bought by
Lexus Development Inc
Create a Home Valuation Report for This Property
The Home Valuation Report is an in-depth analysis detailing your home's value as well as a comparison with similar homes in the area
Home Values in the Area
Average Home Value in this Area
Purchase History
| Date | Buyer | Sale Price | Title Company |
|---|---|---|---|
| Hughes Leslie S | $196,000 | -- | |
| Cox Courtney A | -- | -- | |
| Rowell Wade C | $175,000 | -- | |
| Lexus Development Inc | $85,000 | -- |
Source: Public Records
Mortgage History
| Date | Status | Borrower | Loan Amount |
|---|---|---|---|
| Open | Hughes Leslie S | $202,468 | |
| Previous Owner | Rowell Wade C | $175,000 |
Source: Public Records
Tax History
| Year | Tax Paid | Tax Assessment Tax Assessment Total Assessment is a certain percentage of the fair market value that is determined by local assessors to be the total taxable value of land and additions on the property. | Land | Improvement |
|---|---|---|---|---|
| 2025 | $1,152 | $10,907 | $1,100 | $9,807 |
| 2024 | $925 | $10,907 | $1,100 | $9,807 |
| 2023 | $835 | $7,843 | $1,100 | $6,743 |
| 2022 | $936 | $7,843 | $1,100 | $6,743 |
| 2021 | $1,026 | $7,840 | $0 | $0 |
| 2020 | $915 | $7,840 | $0 | $0 |
| 2019 | $853 | $7,843 | $1,100 | $6,743 |
| 2018 | $808 | $7,840 | $0 | $0 |
| 2017 | $765 | $7,840 | $0 | $0 |
| 2016 | $714 | $7,840 | $0 | $0 |
| 2015 | $746 | $7,840 | $0 | $0 |
| 2014 | $645 | $7,843 | $1,100 | $6,743 |
Source: Public Records
Map
Nearby Homes
- 1224 Gregg Ave
- 1007 W Palmetto St
- 1009 Madison Ave
- 1451 Gregg Ave
- 904 Waverly Ave
- 156 S Carolina Dr
- 705 W Palmetto St
- 321 S Park Ave
- 200 S Homestead Dr
- 0 W Darlington St
- 1001 Adams Ave
- 107 Harrell St
- 614 Gregg Ave
- 1455 Waverly Ave
- 1956 W Darlington St
- 424 Park Ave
- 403 Graham St
- 1619 A, B, & C Gregg Ave
- 600 Greenway Dr
- 1009 Myers Ervin Way
- 213 S Calhoun Dr
- 1205 W Palmetto St
- 1204 Edgewood Ave
- 1208 Edgewood Ave
- 1209 W Palmetto St
- 1113 W Palmetto St
- 211 S Calhoun Dr
- 1211 W Palmetto St
- 1210 Edgewood Ave
- 1109 W Palmetto St
- 214 S Calhoun Dr
- 1201 Edgewood Ave
- 1107 W Palmetto St
- 212 S Calhoun Dr
- 1213 W Palmetto St
- 1205 Edgewood Ave
- 1209 Edgewood Ave
- 1202 W Palmetto St
- 1214 Edgewood Ave
- 1200 W Palmetto St
Your Personal Tour Guide
Ask me questions while you tour the home.