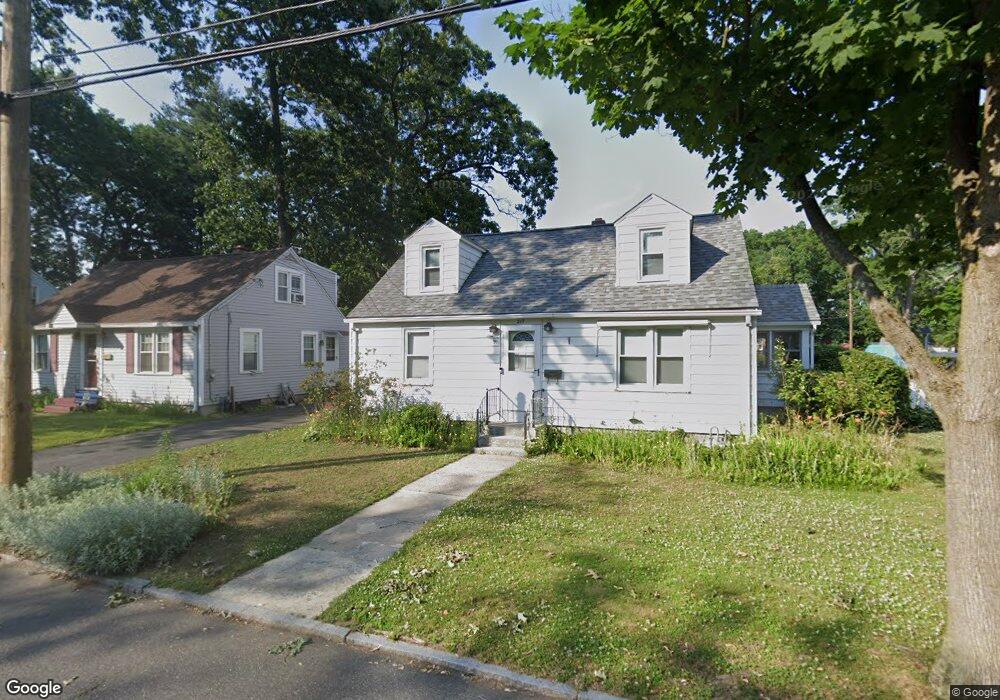
217 Shawmut St Springfield, MA 01108
Forest Park NeighborhoodEstimated Value: $257,286 - $300,000
4
Beds
2
Baths
1,008
Sq Ft
$277/Sq Ft
Est. Value
About This Home
This home is located at 217 Shawmut St, Springfield, MA 01108 and is currently estimated at $279,072, approximately $276 per square foot. 217 Shawmut St is a home located in Hampden County with nearby schools including Alice B. Beal Elementary School, Forest Park Middle School, and High School Of Commerce.
Ownership History
Date
Name
Owned For
Owner Type
Purchase Details
Closed on
Jun 20, 2003
Sold by
Park Aaron Joseph and Hulsebus Cory Lyn
Bought by
Hernandez Juan R
Current Estimated Value
Home Financials for this Owner
Home Financials are based on the most recent Mortgage that was taken out on this home.
Original Mortgage
$124,000
Outstanding Balance
$54,042
Interest Rate
5.71%
Mortgage Type
Purchase Money Mortgage
Estimated Equity
$225,030
Purchase Details
Closed on
Jun 30, 2000
Sold by
Kelleher William P and Kelleher Laura T
Bought by
Park Aaron J and Hulsebus Cory Lyn
Home Financials for this Owner
Home Financials are based on the most recent Mortgage that was taken out on this home.
Original Mortgage
$78,850
Interest Rate
8.59%
Mortgage Type
Purchase Money Mortgage
Purchase Details
Closed on
Oct 10, 1990
Sold by
Peterson Mitchell S
Bought by
Pollack Daniel
Create a Home Valuation Report for This Property
The Home Valuation Report is an in-depth analysis detailing your home's value as well as a comparison with similar homes in the area
Home Values in the Area
Average Home Value in this Area
Purchase History
We collect this data history from publicly available records. To have your information removed, we recommend requesting removal directly through your county’s website.
| Date | Buyer | Sale Price | Title Company |
|---|---|---|---|
| Hernandez Juan R | $124,000 | -- | |
| Park Aaron J | $83,000 | -- | |
| Pollack Daniel | $75,000 | -- |
Source: Public Records
Mortgage History
We collect this data history from publicly available records. To have your information removed, we recommend requesting removal directly through your county’s website.
| Date | Status | Borrower | Loan Amount |
|---|---|---|---|
| Open | Hernandez Juan R | $124,000 | |
| Previous Owner | Pollack Daniel | $65,000 | |
| Previous Owner | Pollack Daniel | $78,850 |
Source: Public Records
Tax History
| Year | Tax Paid | Tax Assessment Tax Assessment Total Assessment is a certain percentage of the fair market value that is determined by local assessors to be the total taxable value of land and additions on the property. | Land | Improvement |
|---|---|---|---|---|
| 2025 | $3,274 | $208,800 | $36,800 | $172,000 |
| 2024 | $3,267 | $203,400 | $36,800 | $166,600 |
| 2023 | $3,344 | $196,100 | $35,100 | $161,000 |
| 2022 | $2,896 | $153,900 | $35,100 | $118,800 |
| 2021 | $2,786 | $147,400 | $31,900 | $115,500 |
| 2020 | $2,515 | $128,800 | $31,900 | $96,900 |
| 2019 | $2,334 | $118,600 | $31,900 | $86,700 |
| 2018 | $2,310 | $117,400 | $31,900 | $85,500 |
| 2017 | $2,247 | $114,300 | $31,900 | $82,400 |
| 2016 | $2,194 | $111,600 | $31,900 | $79,700 |
| 2015 | $2,156 | $109,600 | $31,900 | $77,700 |
Source: Public Records
Map
Nearby Homes
- 139 Tiffany St
- 137 Carroll St
- 141 Shawmut St
- 117-119 Draper St
- 58 Appleton St
- 186 Belvidere St
- 9 Texel Dr
- 147 Belvidere St
- 12-14 Carver St
- 38 Manchester Terrace
- 38 Virginia St
- 129 Cooper St
- 61 Wood Ave
- 24 Hiawatha St
- 148 Jamestown Dr Unit 148
- 115 Jamestown Dr
- 107 Dorset St
- 77 Dorset St
- 34 Castle St
- 115 Pasadena St
Your Personal Tour Guide
Ask me questions while you tour the home.