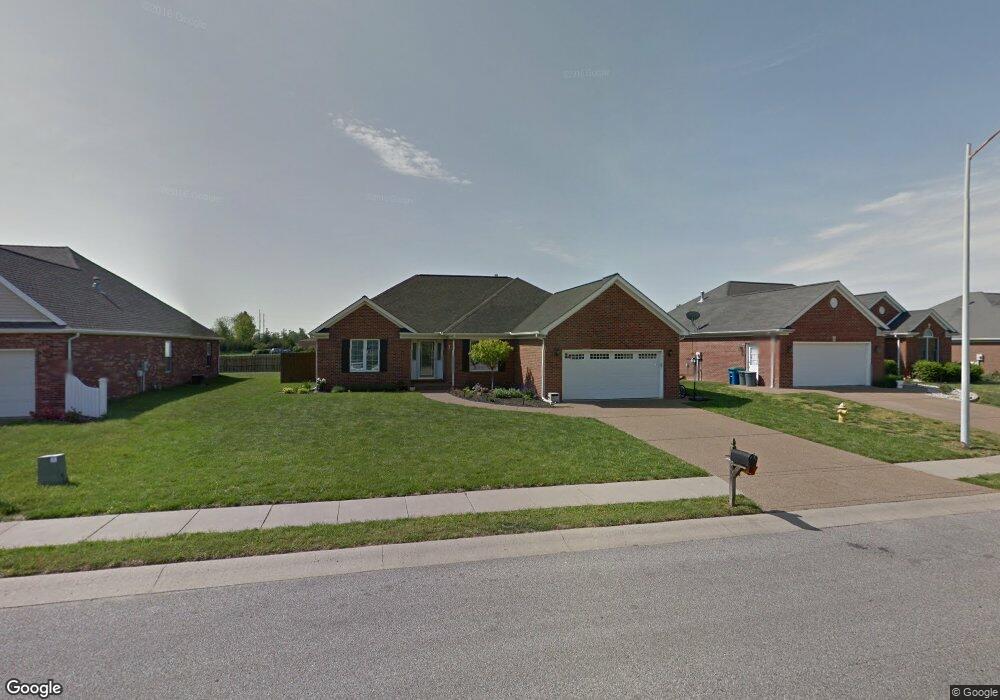
217 Southgate Blvd Newburgh, IN 47630
Estimated Value: $294,521 - $313,000
3
Beds
2
Baths
1,827
Sq Ft
$165/Sq Ft
Est. Value
About This Home
This home is located at 217 Southgate Blvd, Newburgh, IN 47630 and is currently estimated at $301,130, approximately $164 per square foot. 217 Southgate Blvd is a home located in Warrick County with nearby schools including Newburgh Elementary School, Castle North Middle School, and Castle High School.
Ownership History
Date
Name
Owned For
Owner Type
Purchase Details
Closed on
Nov 8, 2012
Sold by
Hunt William S
Bought by
Hunt William S and Hunt Valerie L
Current Estimated Value
Purchase Details
Closed on
Mar 16, 2009
Sold by
Hunt Erica A
Bought by
Hunt William S
Home Financials for this Owner
Home Financials are based on the most recent Mortgage that was taken out on this home.
Original Mortgage
$134,400
Outstanding Balance
$85,411
Interest Rate
5.2%
Mortgage Type
New Conventional
Estimated Equity
$215,719
Purchase Details
Closed on
Aug 13, 2008
Sold by
Lambert Katherine and Miller Katherine L
Bought by
Hunt William S and Hunt Erica A
Home Financials for this Owner
Home Financials are based on the most recent Mortgage that was taken out on this home.
Original Mortgage
$112,500
Interest Rate
6.42%
Mortgage Type
New Conventional
Purchase Details
Closed on
Jan 20, 2006
Sold by
Raab Ronald H and Raab Janice L
Bought by
Lambert Katherine
Create a Home Valuation Report for This Property
The Home Valuation Report is an in-depth analysis detailing your home's value as well as a comparison with similar homes in the area
Home Values in the Area
Average Home Value in this Area
Purchase History
| Date | Buyer | Sale Price | Title Company |
|---|---|---|---|
| Hunt William S | -- | None Available | |
| Hunt William S | -- | None Available | |
| Hunt William S | -- | None Available | |
| Lambert Katherine | -- | None Available |
Source: Public Records
Mortgage History
| Date | Status | Borrower | Loan Amount |
|---|---|---|---|
| Open | Hunt William S | $134,400 | |
| Closed | Hunt William S | $112,500 |
Source: Public Records
Tax History Compared to Growth
Tax History
| Year | Tax Paid | Tax Assessment Tax Assessment Total Assessment is a certain percentage of the fair market value that is determined by local assessors to be the total taxable value of land and additions on the property. | Land | Improvement |
|---|---|---|---|---|
| 2024 | $2,604 | $260,400 | $42,500 | $217,900 |
| 2023 | $2,366 | $254,100 | $42,500 | $211,600 |
| 2022 | $2,208 | $226,600 | $31,700 | $194,900 |
| 2021 | $1,813 | $181,300 | $25,600 | $155,700 |
| 2020 | $1,719 | $171,900 | $25,600 | $146,300 |
| 2019 | $1,695 | $169,500 | $24,900 | $144,600 |
| 2018 | $1,671 | $167,500 | $24,900 | $142,600 |
| 2017 | $1,636 | $163,600 | $24,900 | $138,700 |
| 2016 | $1,520 | $156,500 | $24,900 | $131,600 |
| 2014 | $1,439 | $159,500 | $24,100 | $135,400 |
| 2013 | $1,434 | $162,400 | $24,100 | $138,300 |
Source: Public Records
Map
Nearby Homes
- 213 Westbriar Blvd
- 105 Temple
- Lot 11 Westbriar Cir
- Lot 33 Westbriar Cir
- 9655 Arlington Ct
- 5633 Byerson Dr
- 0 Phelps Dr
- 9860 Pollack Ave
- 9954 Monte Way
- 700 Coppers Edge Dr
- 1060 Jefferson Ct
- 422 W Water St
- 317 W Water St
- 223 W Jennings St
- 519 Monroe St
- 8634 Briarose Ct
- 110 Monroe St
- 9954 Ella Cir
- 6077 River Bluff Dr
- 6000 Glen Oak Ct