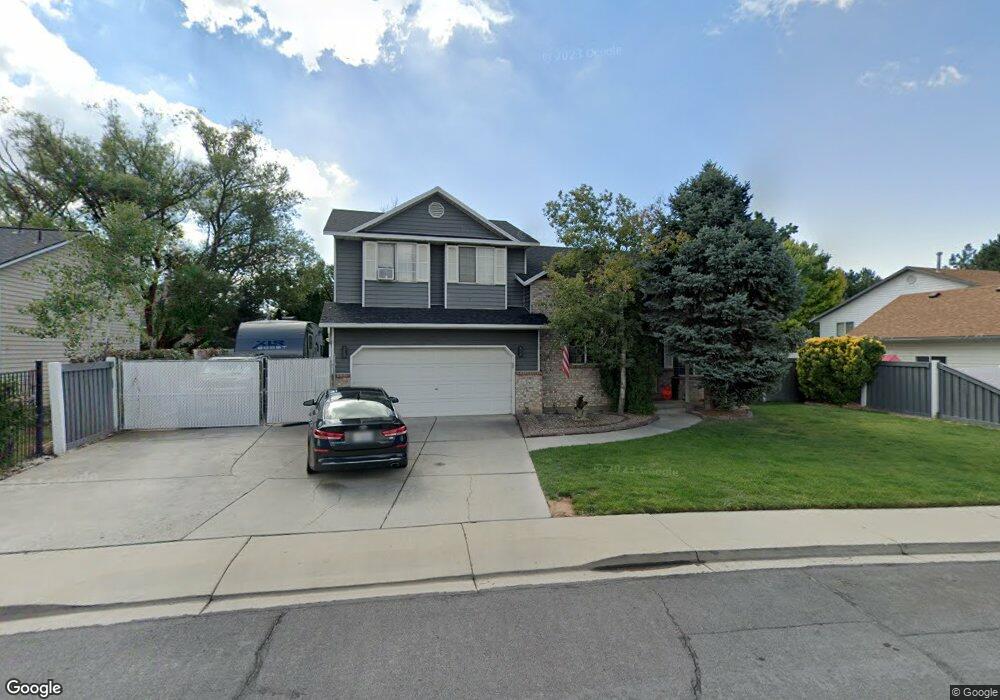
217 W 100 S Orem, UT 84058
Orem Park NeighborhoodEstimated Value: $536,400 - $542,000
3
Beds
2
Baths
1,481
Sq Ft
$364/Sq Ft
Est. Value
About This Home
This home is located at 217 W 100 S, Orem, UT 84058 and is currently estimated at $539,133, approximately $364 per square foot. 217 W 100 S is a home located in Utah County with nearby schools including Orem Elementary School, Orem Junior High School, and Mountain View High School.
Ownership History
Date
Name
Owned For
Owner Type
Purchase Details
Closed on
Jun 7, 2021
Sold by
Cook Brandon
Bought by
Cook Brandon
Current Estimated Value
Home Financials for this Owner
Home Financials are based on the most recent Mortgage that was taken out on this home.
Original Mortgage
$278,000
Outstanding Balance
$251,694
Interest Rate
2.9%
Mortgage Type
New Conventional
Estimated Equity
$287,439
Purchase Details
Closed on
Jan 19, 2016
Sold by
Cook Jennifer
Bought by
Cook Brandon
Purchase Details
Closed on
Jun 5, 2006
Sold by
Perkins Thomas M and Perkins Sally J
Bought by
Cook Brandon and Cook Jennifer
Home Financials for this Owner
Home Financials are based on the most recent Mortgage that was taken out on this home.
Original Mortgage
$51,000
Interest Rate
6.55%
Mortgage Type
Stand Alone Second
Create a Home Valuation Report for This Property
The Home Valuation Report is an in-depth analysis detailing your home's value as well as a comparison with similar homes in the area
Home Values in the Area
Average Home Value in this Area
Purchase History
| Date | Buyer | Sale Price | Title Company |
|---|---|---|---|
| Cook Brandon | -- | Accommodation | |
| Cook Brandon | -- | Inwest Title Orem | |
| Cook Brandon | -- | None Available | |
| Cook Brandon | -- | None Available |
Source: Public Records
Mortgage History
| Date | Status | Borrower | Loan Amount |
|---|---|---|---|
| Open | Cook Brandon | $278,000 | |
| Closed | Cook Brandon | $51,000 | |
| Closed | Cook Brandon | $204,000 |
Source: Public Records
Tax History
| Year | Tax Paid | Tax Assessment Tax Assessment Total Assessment is a certain percentage of the fair market value that is determined by local assessors to be the total taxable value of land and additions on the property. | Land | Improvement |
|---|---|---|---|---|
| 2025 | $2,150 | $282,865 | -- | -- |
| 2024 | $2,150 | $262,955 | $0 | $0 |
| 2023 | $1,994 | $262,075 | $0 | $0 |
| 2022 | $1,940 | $247,005 | $0 | $0 |
| 2021 | $1,806 | $348,300 | $165,000 | $183,300 |
| 2020 | $1,645 | $311,700 | $132,000 | $179,700 |
| 2019 | $1,525 | $300,600 | $121,900 | $178,700 |
| 2018 | $1,445 | $272,100 | $105,000 | $167,100 |
| 2017 | $1,322 | $133,320 | $0 | $0 |
| 2016 | $1,312 | $122,045 | $0 | $0 |
| 2015 | $1,315 | $115,665 | $0 | $0 |
| 2014 | $1,304 | $114,180 | $0 | $0 |
Source: Public Records
Map
Nearby Homes
- 231 W 100 S
- 205 W 100 S
- 98 S 220 W Unit 13
- 98 S 220 W
- 98 S 220 W Unit 20
- 98 S 220 W Unit 22
- 98 S 220 W Unit 16
- 86 S 220 W Unit 11
- 155 S 240 W
- 154 S 200 W
- 206 W 100 S
- 62 S 220 W Unit 1
- 62 S 220 W
- 62 S 220 W Unit 5
- 62 S 220 W Unit 10
- 62 S 220 W Unit 6
- 56 S 220 W
- 56 S 220 W Unit 4
- 56 S 220 W Unit 2
- 56 S 220 W Unit 5
Your Personal Tour Guide
Ask me questions while you tour the home.