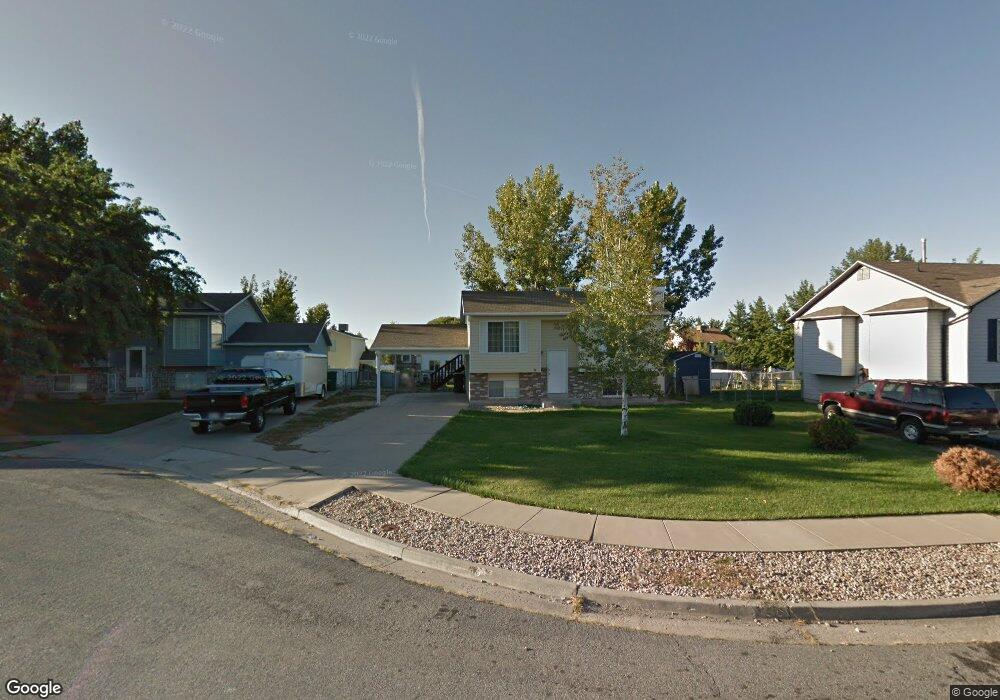
217 W 1650 N Layton, UT 84041
Estimated Value: $392,000 - $437,000
3
Beds
2
Baths
1,525
Sq Ft
$272/Sq Ft
Est. Value
About This Home
This home is located at 217 W 1650 N, Layton, UT 84041 and is currently estimated at $414,705, approximately $271 per square foot. 217 W 1650 N is a home located in Davis County with nearby schools including Lincoln Elementary School, North Layton Junior High School, and Northridge High School.
Ownership History
Date
Name
Owned For
Owner Type
Purchase Details
Closed on
Sep 22, 2010
Sold by
Cummings Shawn M
Bought by
Merrill Eric
Current Estimated Value
Home Financials for this Owner
Home Financials are based on the most recent Mortgage that was taken out on this home.
Original Mortgage
$5,300
Outstanding Balance
$3,471
Interest Rate
4.28%
Mortgage Type
Stand Alone Second
Estimated Equity
$411,234
Purchase Details
Closed on
Feb 1, 1999
Sold by
Cummings Richard S
Bought by
Cummings Shawn M
Home Financials for this Owner
Home Financials are based on the most recent Mortgage that was taken out on this home.
Original Mortgage
$104,652
Interest Rate
6.73%
Mortgage Type
VA
Purchase Details
Closed on
Oct 8, 1996
Sold by
Wright Roland Paul and Wright Bacardi Lockett
Bought by
Cummings Richard S and Cummings Shawn M
Home Financials for this Owner
Home Financials are based on the most recent Mortgage that was taken out on this home.
Original Mortgage
$102,000
Interest Rate
8.5%
Create a Home Valuation Report for This Property
The Home Valuation Report is an in-depth analysis detailing your home's value as well as a comparison with similar homes in the area
Home Values in the Area
Average Home Value in this Area
Purchase History
| Date | Buyer | Sale Price | Title Company |
|---|---|---|---|
| Merrill Eric | -- | Advanced Title Ins Ag Slc | |
| Cummings Shawn M | -- | Mountain View Title | |
| Cummings Richard S | -- | U S Title |
Source: Public Records
Mortgage History
| Date | Status | Borrower | Loan Amount |
|---|---|---|---|
| Open | Merrill Eric | $5,300 | |
| Open | Merrill Eric | $123,339 | |
| Previous Owner | Cummings Shawn M | $104,652 | |
| Previous Owner | Cummings Richard S | $102,000 |
Source: Public Records
Tax History Compared to Growth
Tax History
| Year | Tax Paid | Tax Assessment Tax Assessment Total Assessment is a certain percentage of the fair market value that is determined by local assessors to be the total taxable value of land and additions on the property. | Land | Improvement |
|---|---|---|---|---|
| 2025 | $1,850 | $194,150 | $99,425 | $94,725 |
| 2024 | $1,768 | $187,000 | $116,296 | $70,704 |
| 2023 | $1,771 | $330,000 | $142,463 | $187,537 |
| 2022 | $1,777 | $179,850 | $74,061 | $105,789 |
| 2021 | $1,669 | $252,000 | $100,628 | $151,372 |
| 2020 | $1,505 | $218,000 | $86,031 | $131,969 |
| 2019 | $1,495 | $212,000 | $82,968 | $129,032 |
| 2018 | $1,341 | $191,000 | $82,968 | $108,032 |
| 2016 | $1,233 | $90,585 | $25,621 | $64,964 |
| 2015 | $1,164 | $81,180 | $25,621 | $55,559 |
| 2014 | $1,015 | $72,387 | $25,621 | $46,766 |
| 2013 | -- | $80,595 | $23,739 | $56,856 |
Source: Public Records
Map
Nearby Homes