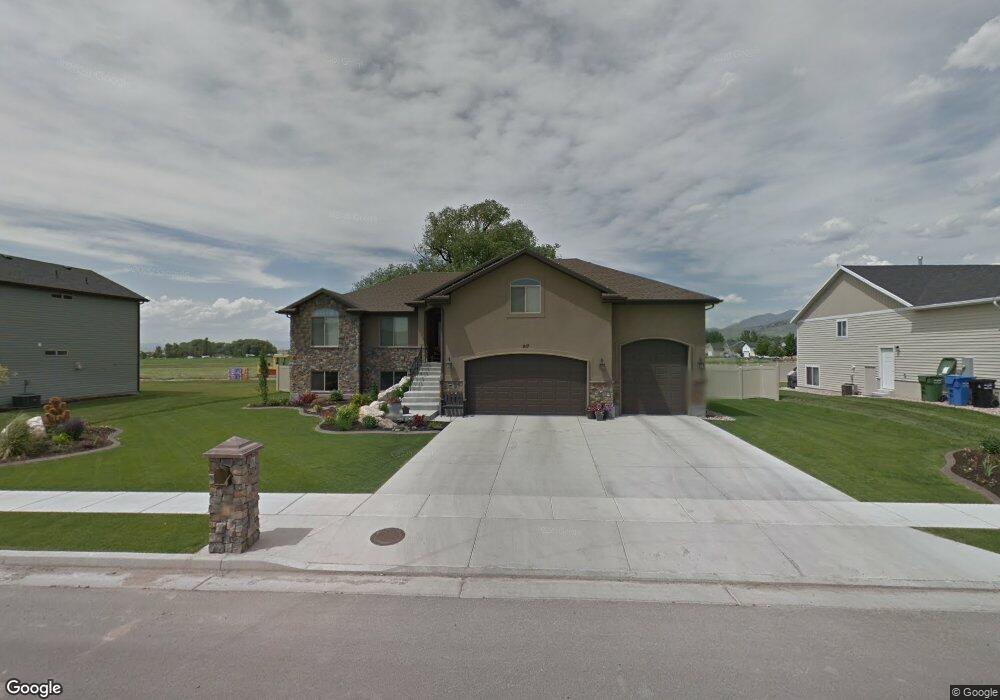
217 W 350 S Unit 2 Hyde Park, UT 84318
Estimated Value: $675,000 - $828,000
--
Bed
--
Bath
1,892
Sq Ft
$384/Sq Ft
Est. Value
About This Home
This home is located at 217 W 350 S Unit 2, Hyde Park, UT 84318 and is currently estimated at $726,739, approximately $384 per square foot. 217 W 350 S Unit 2 is a home located in Cache County with nearby schools including North Park School, Cedar Ridge School, and Cedar Ridge Middle School.
Ownership History
Date
Name
Owned For
Owner Type
Purchase Details
Closed on
Oct 6, 2016
Sold by
Sorensen Jake Daniel and Sorensen Melese
Bought by
Johnson Jeremy and Johnson Leticia
Current Estimated Value
Home Financials for this Owner
Home Financials are based on the most recent Mortgage that was taken out on this home.
Original Mortgage
$323,000
Outstanding Balance
$257,383
Interest Rate
3.44%
Mortgage Type
New Conventional
Estimated Equity
$469,356
Purchase Details
Closed on
Aug 5, 2011
Sold by
J & M Constructors Inc
Bought by
Sorensen Jake Daniel and Sorensen Melese
Home Financials for this Owner
Home Financials are based on the most recent Mortgage that was taken out on this home.
Original Mortgage
$225,046
Interest Rate
4.75%
Mortgage Type
FHA
Create a Home Valuation Report for This Property
The Home Valuation Report is an in-depth analysis detailing your home's value as well as a comparison with similar homes in the area
Home Values in the Area
Average Home Value in this Area
Purchase History
| Date | Buyer | Sale Price | Title Company |
|---|---|---|---|
| Johnson Jeremy | -- | Cache Title Company Inc | |
| Johnson Jeremy | -- | Cache Title Company Inc | |
| Sorensen Jake Daniel | -- | Mountain View Title Ogden | |
| Sorensen Jake Daniel | -- | Mountain View Title Ogden |
Source: Public Records
Mortgage History
| Date | Status | Borrower | Loan Amount |
|---|---|---|---|
| Open | Johnson Jeremy | $323,000 | |
| Previous Owner | Sorensen Jake Daniel | $225,046 |
Source: Public Records
Tax History Compared to Growth
Tax History
| Year | Tax Paid | Tax Assessment Tax Assessment Total Assessment is a certain percentage of the fair market value that is determined by local assessors to be the total taxable value of land and additions on the property. | Land | Improvement |
|---|---|---|---|---|
| 2025 | $2,497 | $344,210 | $0 | $0 |
| 2024 | $3,296 | $419,065 | $0 | $0 |
| 2023 | $3,439 | $415,855 | $0 | $0 |
| 2022 | $3,576 | $415,855 | $0 | $0 |
| 2021 | $2,510 | $458,386 | $71,600 | $386,786 |
| 2020 | $2,349 | $407,936 | $71,600 | $336,336 |
| 2019 | $2,475 | $407,936 | $71,600 | $336,336 |
| 2018 | $2,198 | $355,300 | $55,000 | $300,300 |
| 2017 | $2,204 | $187,550 | $0 | $0 |
| 2016 | $2,236 | $144,105 | $0 | $0 |
Source: Public Records
Map
Nearby Homes
- 217 W 350 S
- 235 W 350 S Unit 3
- 235 W 350 S
- 205 W 350 S Unit 1
- 205 W 350 S
- 218 W 350 S Unit 17
- 218 W 350 S
- 257 W 350 S Unit 4
- 206 W 350 S Unit 18
- 236 W 350 S Unit 16
- 236 W 350 S
- 258 W 350 S Unit 15
- 258 W 350 S
- 350 S 200 W
- 334 S 200 W
- 273 W 350 S Unit 5
- 273 W 350 S
- 300 S 200 W
- 366 S 200 W Unit 17
- 182 W 300 S