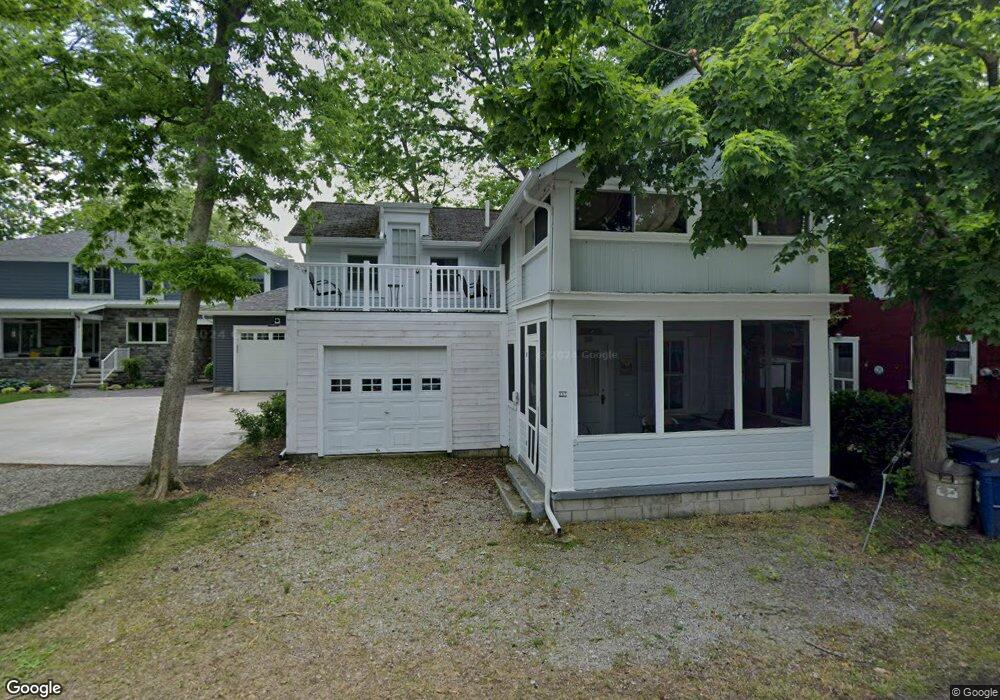
217 W 4th St Lakeside Marblehead, OH 43440
Estimated Value: $376,963 - $603,000
4
Beds
2
Baths
1,019
Sq Ft
$483/Sq Ft
Est. Value
About This Home
This home is located at 217 W 4th St, Lakeside Marblehead, OH 43440 and is currently estimated at $491,991, approximately $482 per square foot. 217 W 4th St is a home located in Ottawa County with nearby schools including Danbury Middle School and Danbury High School.
Ownership History
Date
Name
Owned For
Owner Type
Purchase Details
Closed on
Aug 12, 2007
Sold by
Kington J Anthony
Bought by
Kington J Anthony and J Anthony Kington Amended & Restated Rev
Current Estimated Value
Home Financials for this Owner
Home Financials are based on the most recent Mortgage that was taken out on this home.
Original Mortgage
$209,600
Interest Rate
6.87%
Mortgage Type
New Conventional
Purchase Details
Closed on
Jul 24, 2007
Sold by
Boyce Martha E and Kington Martha B
Bought by
Kington J Anthony
Home Financials for this Owner
Home Financials are based on the most recent Mortgage that was taken out on this home.
Original Mortgage
$209,600
Interest Rate
6.87%
Mortgage Type
New Conventional
Purchase Details
Closed on
Sep 22, 1992
Sold by
Mieser Wilbur and Mieser Dorothy
Bought by
Knighton Knighton J and Knighton Martha B
Create a Home Valuation Report for This Property
The Home Valuation Report is an in-depth analysis detailing your home's value as well as a comparison with similar homes in the area
Home Values in the Area
Average Home Value in this Area
Purchase History
| Date | Buyer | Sale Price | Title Company |
|---|---|---|---|
| Kington J Anthony | -- | Hbi Title Services Inc | |
| Kington J Anthony | -- | Hbi Title Services Inc | |
| Knighton Knighton J | $66,000 | -- |
Source: Public Records
Mortgage History
| Date | Status | Borrower | Loan Amount |
|---|---|---|---|
| Previous Owner | Kington J Anthony | $209,600 |
Source: Public Records
Tax History Compared to Growth
Tax History
| Year | Tax Paid | Tax Assessment Tax Assessment Total Assessment is a certain percentage of the fair market value that is determined by local assessors to be the total taxable value of land and additions on the property. | Land | Improvement |
|---|---|---|---|---|
| 2024 | $3,425 | $100,482 | $25,260 | $75,222 |
| 2023 | $3,425 | $73,532 | $19,432 | $54,100 |
| 2022 | $2,539 | $73,532 | $19,432 | $54,100 |
| 2021 | $2,546 | $73,530 | $19,430 | $54,100 |
| 2020 | $2,228 | $60,890 | $19,050 | $41,840 |
| 2019 | $2,062 | $60,890 | $19,050 | $41,840 |
| 2018 | $2,220 | $60,890 | $19,050 | $41,840 |
| 2017 | $1,978 | $53,210 | $14,110 | $39,100 |
| 2016 | $1,960 | $53,210 | $14,110 | $39,100 |
| 2015 | $1,970 | $53,210 | $14,110 | $39,100 |
| 2014 | $984 | $51,920 | $14,110 | $37,810 |
| 2013 | $1,838 | $51,920 | $14,110 | $37,810 |
Source: Public Records
Map
Nearby Homes