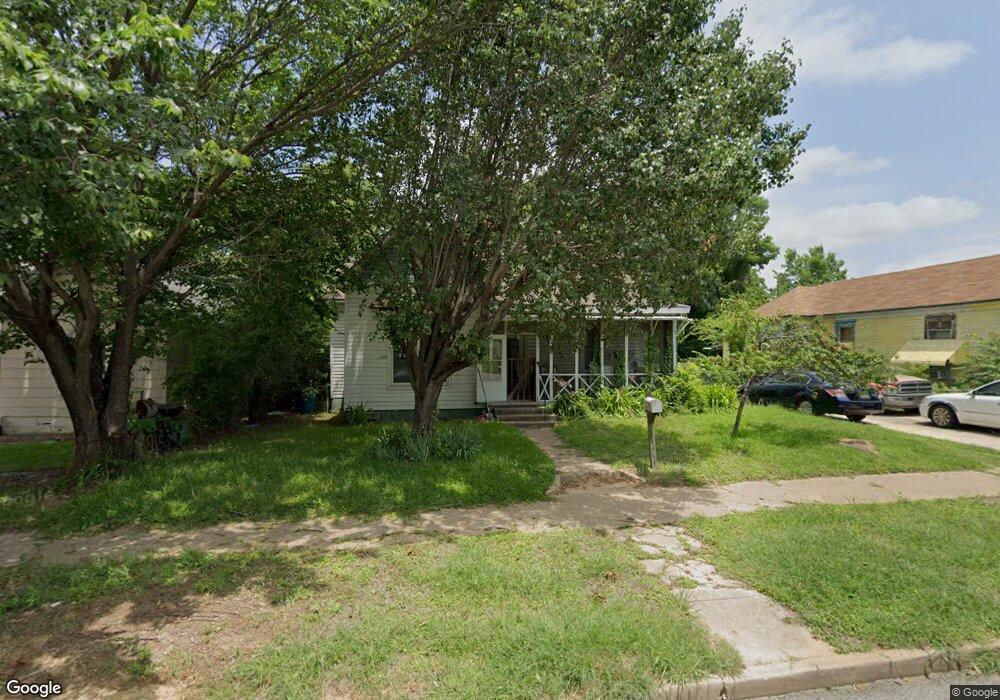
217 W Hull St Denison, TX 75020
Estimated Value: $143,883 - $236,000
--
Bed
--
Bath
1,387
Sq Ft
$137/Sq Ft
Est. Value
About This Home
This home is located at 217 W Hull St, Denison, TX 75020 and is currently estimated at $189,942, approximately $136 per square foot. 217 W Hull St is a home located in Grayson County with nearby schools including Scott Middle School, Denison High School, and St. Luke's Parish Day School.
Ownership History
Date
Name
Owned For
Owner Type
Purchase Details
Closed on
Sep 22, 2025
Sold by
Reynolds Esther Bahlman
Bought by
Passageway Properties Llc
Current Estimated Value
Home Financials for this Owner
Home Financials are based on the most recent Mortgage that was taken out on this home.
Original Mortgage
$75,000
Outstanding Balance
$75,000
Interest Rate
6.63%
Mortgage Type
Construction
Estimated Equity
$114,942
Purchase Details
Closed on
Sep 5, 2025
Sold by
Beatty Brandon
Bought by
Southern Hills Property Group Llc
Home Financials for this Owner
Home Financials are based on the most recent Mortgage that was taken out on this home.
Original Mortgage
$75,000
Outstanding Balance
$75,000
Interest Rate
6.63%
Mortgage Type
Construction
Estimated Equity
$114,942
Purchase Details
Closed on
Nov 6, 2007
Sold by
Gallagher Thomas and Gallagher Frances
Bought by
Reynolds Roger and Reynolds Esther
Purchase Details
Closed on
Jan 24, 2005
Sold by
Mcdaniel Homer
Bought by
Reynolds Esther
Create a Home Valuation Report for This Property
The Home Valuation Report is an in-depth analysis detailing your home's value as well as a comparison with similar homes in the area
Home Values in the Area
Average Home Value in this Area
Purchase History
| Date | Buyer | Sale Price | Title Company |
|---|---|---|---|
| Passageway Properties Llc | -- | Simplifile (Recording Service) | |
| Southern Hills Property Group Llc | -- | -- | |
| Reynolds Roger | $40,240 | None Available | |
| Reynolds Esther | -- | -- |
Source: Public Records
Mortgage History
| Date | Status | Borrower | Loan Amount |
|---|---|---|---|
| Open | Passageway Properties Llc | $75,000 |
Source: Public Records
Tax History Compared to Growth
Tax History
| Year | Tax Paid | Tax Assessment Tax Assessment Total Assessment is a certain percentage of the fair market value that is determined by local assessors to be the total taxable value of land and additions on the property. | Land | Improvement |
|---|---|---|---|---|
| 2025 | $424 | $140,835 | $42,863 | $97,972 |
| 2024 | $2,483 | $106,855 | $0 | $0 |
| 2023 | $424 | $97,141 | $0 | $0 |
| 2022 | $2,098 | $88,310 | $0 | $0 |
| 2021 | $2,025 | $85,845 | $23,963 | $61,882 |
| 2020 | $1,925 | $80,871 | $18,000 | $62,871 |
| 2019 | $1,826 | $77,945 | $13,163 | $64,782 |
| 2018 | $1,673 | $67,455 | $9,000 | $58,455 |
| 2017 | $1,534 | $58,972 | $3,600 | $55,372 |
| 2016 | $1,395 | $52,324 | $3,600 | $48,724 |
| 2015 | $0 | $45,317 | $3,600 | $41,717 |
| 2014 | -- | $45,613 | $3,600 | $42,013 |
Source: Public Records
Map
Nearby Homes
- 221 W Monterey St
- 326 W Day St
- 309 W Monterey St
- 330 W Texas St
- 110 E Munson St
- 408 W Day St
- 1110 S Houston Ave
- 430 W Munson St
- TBD S Austin Ave
- 415 W Monterey St
- 129 Texas E
- 511 W Munson St
- 513 W Texas St
- 231 W Murray St
- 111 W Murray St
- 408 W Heron St
- 101 E Murray St
- 326-328 W Morgan St
- 328 W Murray St
- 330 W Morgan St
- 217 W Hull St
- 211 W Hull St
- 221 W Hull St
- 231 W Hull St
- 201 Hanna Dr
- 931 S Austin Ave
- 218 W Munson St
- 214 W Munson St
- 222 W Munson St
- 226 W Munson St
- 288 W Hull St
- 224 W Hull St
- 224 W Hull St Unit B
- 204 W Munson St
- 218 W Hull St
- TBD S Rusk Ave
- 208 W Hull St
- 230 W Munson St
- 230 W Hull St
- 1001 S Austin Ave