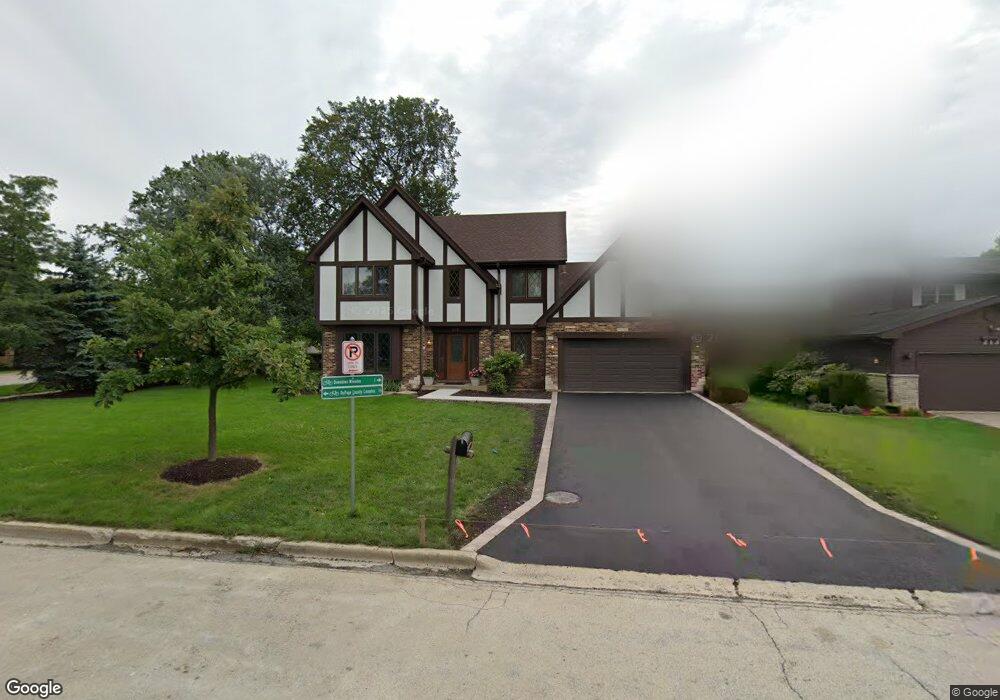
217 White Oak Dr Wheaton, IL 60187
West Wheaton NeighborhoodEstimated Value: $577,000 - $729,000
4
Beds
3
Baths
2,421
Sq Ft
$268/Sq Ft
Est. Value
About This Home
This home is located at 217 White Oak Dr, Wheaton, IL 60187 and is currently estimated at $649,330, approximately $268 per square foot. 217 White Oak Dr is a home located in DuPage County with nearby schools including Clarence E Culver School, Emerson Elementary School, and Monroe Middle School.
Ownership History
Date
Name
Owned For
Owner Type
Purchase Details
Closed on
Jun 17, 2025
Sold by
Marro Lee S and Prior Lee Samuelson
Bought by
Lee Samuelson Revocable Trust and Prior
Current Estimated Value
Purchase Details
Closed on
Aug 14, 2002
Sold by
Archer Scott K and Archer Nancy S
Bought by
Prior Mark R and Marro Lee S
Home Financials for this Owner
Home Financials are based on the most recent Mortgage that was taken out on this home.
Original Mortgage
$275,200
Interest Rate
6.34%
Purchase Details
Closed on
Apr 21, 1999
Sold by
Hepp Meride G
Bought by
Archer Scott K and Berg Nancy S
Home Financials for this Owner
Home Financials are based on the most recent Mortgage that was taken out on this home.
Original Mortgage
$256,500
Interest Rate
6.5%
Create a Home Valuation Report for This Property
The Home Valuation Report is an in-depth analysis detailing your home's value as well as a comparison with similar homes in the area
Home Values in the Area
Average Home Value in this Area
Purchase History
| Date | Buyer | Sale Price | Title Company |
|---|---|---|---|
| Lee Samuelson Revocable Trust | -- | None Listed On Document | |
| Prior Mark R | $344,000 | -- | |
| Archer Scott K | $284,666 | First American Title Ins |
Source: Public Records
Mortgage History
| Date | Status | Borrower | Loan Amount |
|---|---|---|---|
| Previous Owner | Prior Mark R | $275,200 | |
| Previous Owner | Archer Scott K | $256,500 | |
| Closed | Prior Mark R | $51,600 |
Source: Public Records
Tax History Compared to Growth
Tax History
| Year | Tax Paid | Tax Assessment Tax Assessment Total Assessment is a certain percentage of the fair market value that is determined by local assessors to be the total taxable value of land and additions on the property. | Land | Improvement |
|---|---|---|---|---|
| 2024 | $11,775 | $193,043 | $40,610 | $152,433 |
| 2023 | $11,322 | $175,530 | $37,380 | $138,150 |
| 2022 | $11,073 | $165,890 | $35,330 | $130,560 |
| 2021 | $11,037 | $161,950 | $34,490 | $127,460 |
| 2020 | $11,004 | $160,440 | $34,170 | $126,270 |
| 2019 | $10,754 | $156,210 | $33,270 | $122,940 |
| 2018 | $10,555 | $151,730 | $31,340 | $120,390 |
| 2017 | $10,400 | $146,130 | $30,180 | $115,950 |
| 2016 | $10,264 | $140,290 | $28,970 | $111,320 |
| 2015 | $10,189 | $133,840 | $27,640 | $106,200 |
| 2014 | $7,968 | $104,270 | $18,710 | $85,560 |
| 2013 | $7,764 | $104,590 | $18,770 | $85,820 |
Source: Public Records
Map
Nearby Homes
- 119 N Dorchester Ave
- 200 N Erie St
- 1321 W Liberty Dr
- 0S015 Cottonwood Dr
- 0N042 Nepil Ave
- 505 S Knollwood Dr
- 615 Polo Dr
- 26W278 Harrison Ave
- 1489 Woodcutter Ln Unit A
- 1222 Champion Forest Ct
- 1785 Grosvenor Cir Unit A
- 2059 W Roosevelt Rd
- 620 Crest St
- 0S064 Calvin Ct
- 904 Dartmouth Dr
- 906 W Roosevelt Rd
- S045 Pleasant Hill Rd
- 100 N Gary Ave Unit 304
- 418 W Franklin St
- 921 & 933 N College Ave
- 213 White Oak Dr
- 1608 Manchester Rd
- 209 White Oak Dr
- 214 White Oak Dr
- 210 N Pierce Ave
- 210 White Oak Dr
- 205 White Oak Dr
- 206 N Pierce Ave
- 206 White Oak Dr
- 1762 Manchester Rd
- 1601 Manchester Rd
- 1601 Manchester Rd
- 1601 Manchester Rd
- 1601 Manchester Rd
- 1520 Manchester Rd
- 202 N Pierce Ave
- 201 White Oak Dr
- 1766 Manchester Rd
- 1725 Maple Leaf Ct
- 219 N Pierce Ave