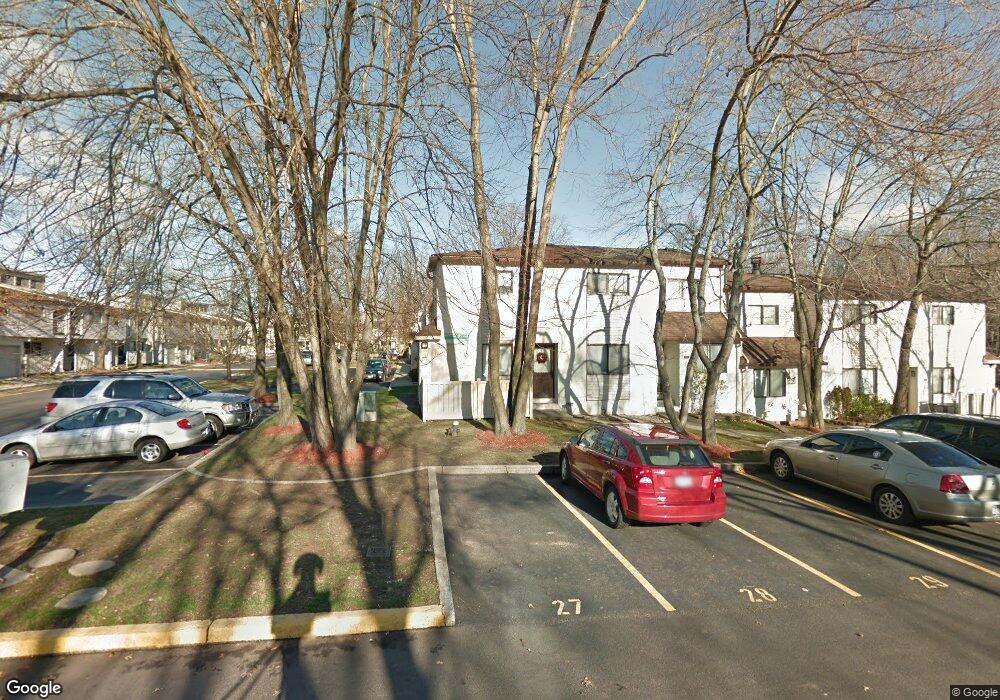
217 Winding Woods Loop Unit 53 Staten Island, NY 10307
Tottenville NeighborhoodEstimated Value: $369,000 - $482,000
2
Beds
2
Baths
690
Sq Ft
$610/Sq Ft
Est. Value
About This Home
This home is located at 217 Winding Woods Loop Unit 53, Staten Island, NY 10307 and is currently estimated at $420,733, approximately $609 per square foot. 217 Winding Woods Loop Unit 53 is a home located in Richmond County with nearby schools including P.S. 6 Cpl Allan F Kivlehan School, Is 34 Tottenville, and Tottenville High School.
Ownership History
Date
Name
Owned For
Owner Type
Purchase Details
Closed on
Apr 12, 2005
Sold by
Roina Joseph J and Roina Victoria L
Bought by
Mundy Jason
Current Estimated Value
Home Financials for this Owner
Home Financials are based on the most recent Mortgage that was taken out on this home.
Original Mortgage
$247,000
Outstanding Balance
$128,866
Interest Rate
5.95%
Mortgage Type
FHA
Estimated Equity
$291,867
Purchase Details
Closed on
Nov 24, 1999
Sold by
Sergi Carmela R
Bought by
Roina Joseph J and Roina Victoria L
Home Financials for this Owner
Home Financials are based on the most recent Mortgage that was taken out on this home.
Original Mortgage
$111,500
Interest Rate
8.21%
Purchase Details
Closed on
Feb 13, 1997
Sold by
Zarrella John M and Cameron Debra J
Bought by
Sergi Carmela R
Create a Home Valuation Report for This Property
The Home Valuation Report is an in-depth analysis detailing your home's value as well as a comparison with similar homes in the area
Home Values in the Area
Average Home Value in this Area
Purchase History
| Date | Buyer | Sale Price | Title Company |
|---|---|---|---|
| Mundy Jason | $260,000 | First Amer Title Ins Co Ny | |
| Roina Joseph J | $115,000 | -- | |
| Sergi Carmela R | $85,000 | -- |
Source: Public Records
Mortgage History
| Date | Status | Borrower | Loan Amount |
|---|---|---|---|
| Open | Mundy Jason | $247,000 | |
| Previous Owner | Roina Joseph J | $111,500 |
Source: Public Records
Tax History Compared to Growth
Tax History
| Year | Tax Paid | Tax Assessment Tax Assessment Total Assessment is a certain percentage of the fair market value that is determined by local assessors to be the total taxable value of land and additions on the property. | Land | Improvement |
|---|---|---|---|---|
| 2025 | $2,968 | $20,961 | $1,765 | $19,196 |
| 2024 | $2,968 | $21,161 | $1,708 | $19,453 |
| 2023 | $3,001 | $14,778 | $1,606 | $13,172 |
| 2022 | $2,827 | $20,088 | $2,446 | $17,642 |
| 2021 | $2,812 | $17,482 | $2,446 | $15,036 |
| 2020 | $2,668 | $16,885 | $2,446 | $14,439 |
| 2019 | $2,576 | $15,778 | $2,446 | $13,332 |
| 2018 | $2,510 | $12,315 | $2,040 | $10,275 |
| 2017 | $2,406 | $11,802 | $2,119 | $9,683 |
| 2016 | $2,226 | $11,134 | $2,044 | $9,090 |
| 2015 | $1,970 | $10,504 | $2,446 | $8,058 |
| 2014 | $1,970 | $10,263 | $2,446 | $7,817 |
Source: Public Records
Map
Nearby Homes
- 110 Surfside Plaza Unit 88
- 108 Surfside Plaza Unit 87
- 327 Sprague Ave
- 320 Sprague Ave
- 61 Billop Ave
- 660 Rockaway St
- 539 Yetman Ave
- 57 Sunset Ln
- 443 Manhattan St
- 220 Sprague Ave
- 11 Lulu Ct
- 14 Ottavio Promenade
- 434 Yetman Ave
- 36 Adlers Ln
- 329 George St
- 43 Ottavio Promenade
- 284 Chelsea St
- 411 Yetman Ave
- 403 Yetman Ave
- 80 Belwood Loop
- 219 Winding Woods Loop Unit 52
- 99 Surfside Plaza Unit 51
- 101 Surfside Plaza Unit 50
- 223 Winding Woods Loop Unit 233
- 392 Sprague Ave Unit 56
- 103 Surfside Plaza Unit 49
- 390 Sprague Ave Unit 57
- 388 Sprague Ave Unit 58
- 107 Surfside Plaza Unit 47
- 386 Sprague Ave Unit 59
- 384 Sprague Ave Unit 60
- 378 Sprague Ave Unit 46
- 380 Sprague Ave Unit 61
- 122 Surfside Plaza Unit 94
- 106 Surfside Plaza Unit 86
- 205 Winding Woods Loop Unit 83
- 195 Winding Woods Loop Unit 79
- 189 Winding Woods Loop Unit 76
- 187 Winding Woods Loop Unit 75
- 179 Winding Woods Loop Unit 71