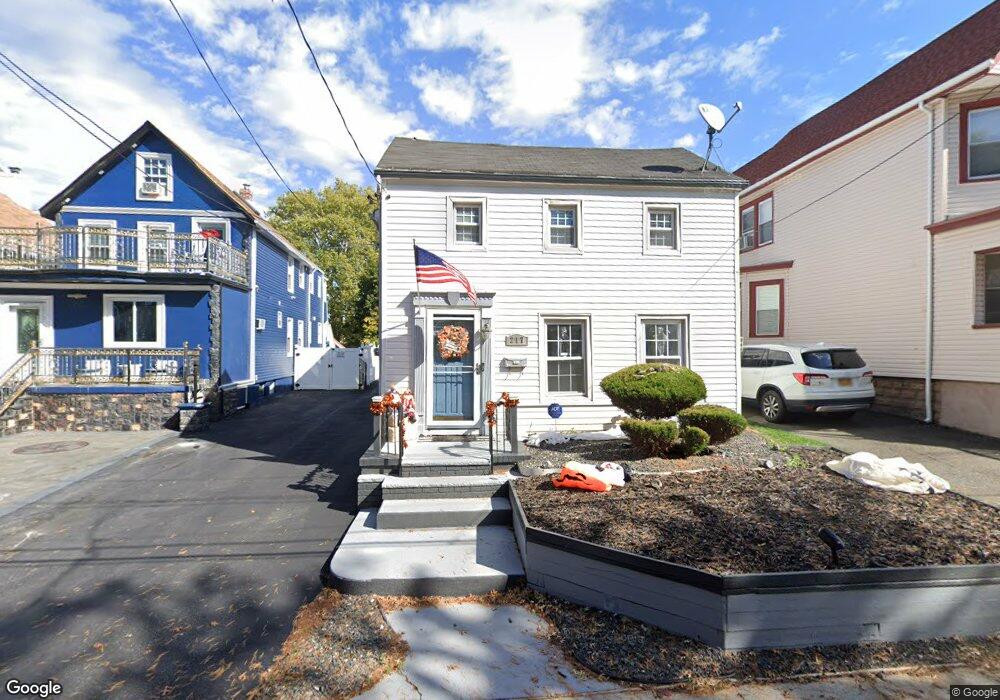
217 Yetman Ave Staten Island, NY 10307
Tottenville NeighborhoodEstimated Value: $587,000 - $817,000
3
Beds
2
Baths
1,950
Sq Ft
$356/Sq Ft
Est. Value
About This Home
This home is located at 217 Yetman Ave, Staten Island, NY 10307 and is currently estimated at $693,829, approximately $355 per square foot. 217 Yetman Ave is a home located in Richmond County with nearby schools including P.S. 1 Tottenville, Is 34 Tottenville, and Tottenville High School.
Ownership History
Date
Name
Owned For
Owner Type
Purchase Details
Closed on
May 31, 2006
Sold by
Paccione John Robert and Paccione Jennifer
Bought by
Moukazis Nicholas and Moukazis Stephanie
Current Estimated Value
Home Financials for this Owner
Home Financials are based on the most recent Mortgage that was taken out on this home.
Original Mortgage
$368,000
Outstanding Balance
$216,959
Interest Rate
6.62%
Mortgage Type
New Conventional
Estimated Equity
$476,870
Purchase Details
Closed on
May 4, 2001
Sold by
Fenley Michelle Honore
Bought by
Paccione John Robert and Paccione Jennifer
Home Financials for this Owner
Home Financials are based on the most recent Mortgage that was taken out on this home.
Original Mortgage
$170,000
Interest Rate
7.09%
Create a Home Valuation Report for This Property
The Home Valuation Report is an in-depth analysis detailing your home's value as well as a comparison with similar homes in the area
Home Values in the Area
Average Home Value in this Area
Purchase History
| Date | Buyer | Sale Price | Title Company |
|---|---|---|---|
| Moukazis Nicholas | $483,000 | Commonwealth Land Title Insu | |
| Paccione John Robert | $180,000 | Fidelity National Title Ins |
Source: Public Records
Mortgage History
| Date | Status | Borrower | Loan Amount |
|---|---|---|---|
| Open | Moukazis Nicholas | $368,000 | |
| Previous Owner | Paccione John Robert | $170,000 |
Source: Public Records
Tax History Compared to Growth
Tax History
| Year | Tax Paid | Tax Assessment Tax Assessment Total Assessment is a certain percentage of the fair market value that is determined by local assessors to be the total taxable value of land and additions on the property. | Land | Improvement |
|---|---|---|---|---|
| 2025 | $4,058 | $39,300 | $6,988 | $32,312 |
| 2024 | $4,058 | $41,940 | $6,186 | $35,754 |
| 2023 | $3,929 | $19,348 | $5,603 | $13,745 |
| 2022 | $3,862 | $39,720 | $12,840 | $26,880 |
| 2021 | $3,973 | $33,540 | $12,840 | $20,700 |
| 2020 | $3,773 | $30,360 | $12,840 | $17,520 |
| 2019 | $3,522 | $30,360 | $12,840 | $17,520 |
| 2018 | $3,287 | $16,123 | $8,802 | $7,321 |
| 2017 | $3,287 | $16,123 | $7,684 | $8,439 |
| 2016 | $3,145 | $15,733 | $8,252 | $7,481 |
| 2015 | $2,693 | $14,853 | $7,880 | $6,973 |
| 2014 | $2,693 | $14,032 | $8,121 | $5,911 |
Source: Public Records
Map
Nearby Homes
- 147 Wood Ave
- 217-219 Fisher Ave
- 233 Fisher Ave
- 7546 Amboy Rd
- 197 Craig Ave
- 112 Johnson Ave
- 21 Sprague Ave
- 133 Fisher Ave
- 24 Sapphire Ct
- 5265 Arthur Kill Rd
- 0 Minerva Ave Unit 495865
- 140 Craig Ave
- 141 Butler Ave
- 137 Butler Ave
- 151 Bentley St
- 133 Butler Ave
- 397 Ellis St
- 7036 Amboy Rd
- 155 Bentley St
- 42 Girard St