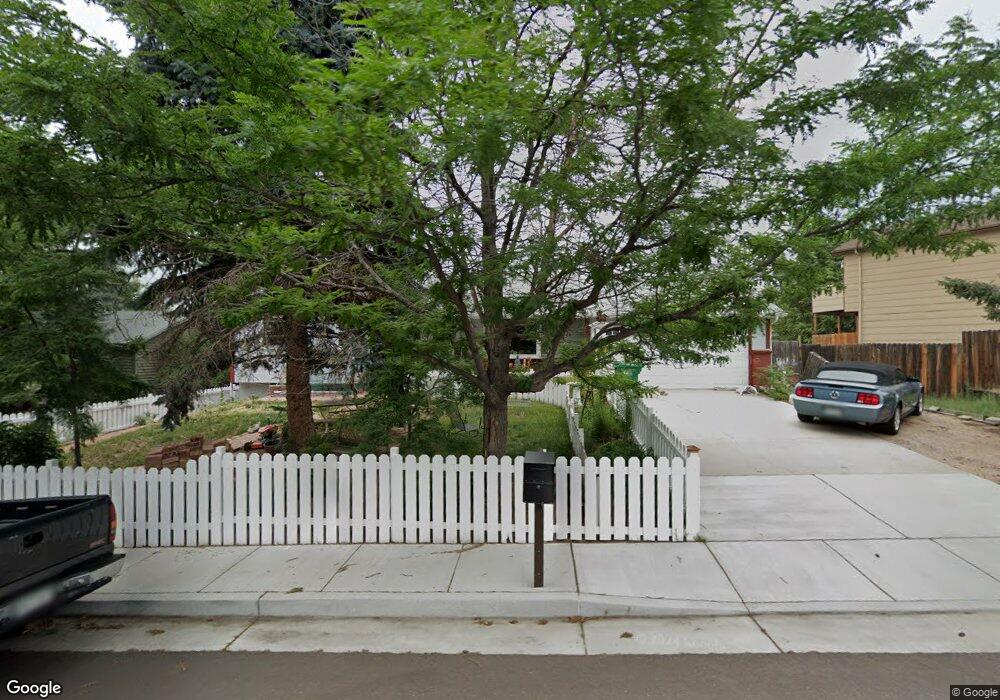
2170 Chapel Hills Dr Colorado Springs, CO 80920
Falcon Estates NeighborhoodEstimated Value: $383,562 - $423,000
3
Beds
1
Bath
1,106
Sq Ft
$364/Sq Ft
Est. Value
About This Home
This home is located at 2170 Chapel Hills Dr, Colorado Springs, CO 80920 and is currently estimated at $402,391, approximately $363 per square foot. 2170 Chapel Hills Dr is a home located in El Paso County with nearby schools including High Plains Elementary School, Mountain Ridge Middle School, and Rampart High School.
Ownership History
Date
Name
Owned For
Owner Type
Purchase Details
Closed on
Jan 2, 2001
Sold by
Minerich Mark E
Bought by
Minerich Mark E and Minerich Cathi E
Current Estimated Value
Purchase Details
Closed on
Apr 28, 2000
Sold by
Abbott John W and Abbott Judith M
Bought by
Minerich Mark E
Home Financials for this Owner
Home Financials are based on the most recent Mortgage that was taken out on this home.
Original Mortgage
$117,000
Outstanding Balance
$40,566
Interest Rate
8.19%
Estimated Equity
$361,825
Purchase Details
Closed on
Aug 1, 1988
Bought by
Minerich Mark E
Purchase Details
Closed on
Dec 1, 1987
Bought by
Minerich Cathi E
Purchase Details
Closed on
Jun 1, 1987
Bought by
Minerich Cathi E
Purchase Details
Closed on
Apr 1, 1986
Bought by
Minerich Cathi E
Purchase Details
Closed on
Oct 1, 1984
Bought by
Minerich Mark E
Purchase Details
Closed on
Jan 1, 1982
Bought by
Minerich Mark E
Create a Home Valuation Report for This Property
The Home Valuation Report is an in-depth analysis detailing your home's value as well as a comparison with similar homes in the area
Home Values in the Area
Average Home Value in this Area
Purchase History
| Date | Buyer | Sale Price | Title Company |
|---|---|---|---|
| Minerich Mark E | -- | -- | |
| Minerich Mark E | $130,000 | -- | |
| Minerich Mark E | -- | -- | |
| Minerich Cathi E | -- | -- | |
| Minerich Cathi E | -- | -- | |
| Minerich Cathi E | -- | -- | |
| Minerich Mark E | -- | -- | |
| Minerich Mark E | -- | -- |
Source: Public Records
Mortgage History
| Date | Status | Borrower | Loan Amount |
|---|---|---|---|
| Open | Minerich Mark E | $117,000 |
Source: Public Records
Tax History Compared to Growth
Tax History
| Year | Tax Paid | Tax Assessment Tax Assessment Total Assessment is a certain percentage of the fair market value that is determined by local assessors to be the total taxable value of land and additions on the property. | Land | Improvement |
|---|---|---|---|---|
| 2025 | $1,623 | $29,790 | -- | -- |
| 2024 | $1,156 | $31,000 | $5,360 | $25,640 |
| 2022 | $965 | $21,530 | $4,340 | $17,190 |
| 2021 | $1,582 | $22,140 | $4,460 | $17,680 |
| 2020 | $1,465 | $19,030 | $3,720 | $15,310 |
| 2019 | $1,449 | $19,030 | $3,720 | $15,310 |
| 2018 | $1,142 | $14,740 | $2,880 | $11,860 |
| 2017 | $1,138 | $14,740 | $2,880 | $11,860 |
| 2016 | $1,145 | $14,810 | $2,930 | $11,880 |
| 2015 | $1,143 | $14,810 | $2,930 | $11,880 |
| 2014 | $1,069 | $13,840 | $2,930 | $10,910 |
Source: Public Records
Map
Nearby Homes
- 2110 Whitehorn Dr N
- 1884 Fuller Rd
- 2650 Bannister Ct
- 1907 Independence Dr
- 1880 Independence Dr
- 1932 Silkwood Dr
- 2512 Elite Terrace
- 8146 Horizon Dr
- 2068 Silkwood Dr
- 2615 Thrush Grove
- 2006 Summerset Dr
- 2546 Hatch Cir
- 7849 Flicker Grove
- 2570 Hatch Cir
- 2661 Hatch Cir
- 8161 Regiment Ct
- 6881 Los Reyes Cir
- 2579 Hatch Cir
- 2114 Summerset Dr
- 6872 Los Reyes Cir
- 2180 Chapel Hills Dr
- 2160 Chapel Hills Dr
- 2145 Berthoud Ct
- 2155 Berthoud Ct
- 2140 Chapel Hills Dr
- 2135 Berthoud Ct
- 2203 Berthoud Ct
- 2206 Chapel Hills Dr
- 2165 Chapel Hills Dr
- 2155 Chapel Hills Dr
- 2185 Chapel Hills Dr
- 2125 Berthoud Ct
- 2130 Chapel Hills Dr
- 2135 Chapel Hills Dr
- 2222 Chapel Hills Dr
- 2219 Berthoud Ct
- 2205 Chapel Hills Dr
- 2225 Chapel Hills Dr
- 2125 Chapel Hills Dr
- 2130 Berthoud Ct